Connection status
The page header shows a colored indicator next to the connection state:- Green — Connected: the WebSocket connection to the OpenClaw Gateway is open and the dashboard is receiving live updates
- Red — Not connected: the connection is down; the page will retry automatically with exponential backoff (starting at 1 second, capping at 30 seconds)
The Live Monitor maintains two update mechanisms simultaneously: a WebSocket subscription for push-based updates and a 5-second polling fallback. This means you continue to see fresh data even if the WebSocket connection drops temporarily.
Session status
| Status | Color | Meaning |
|---|---|---|
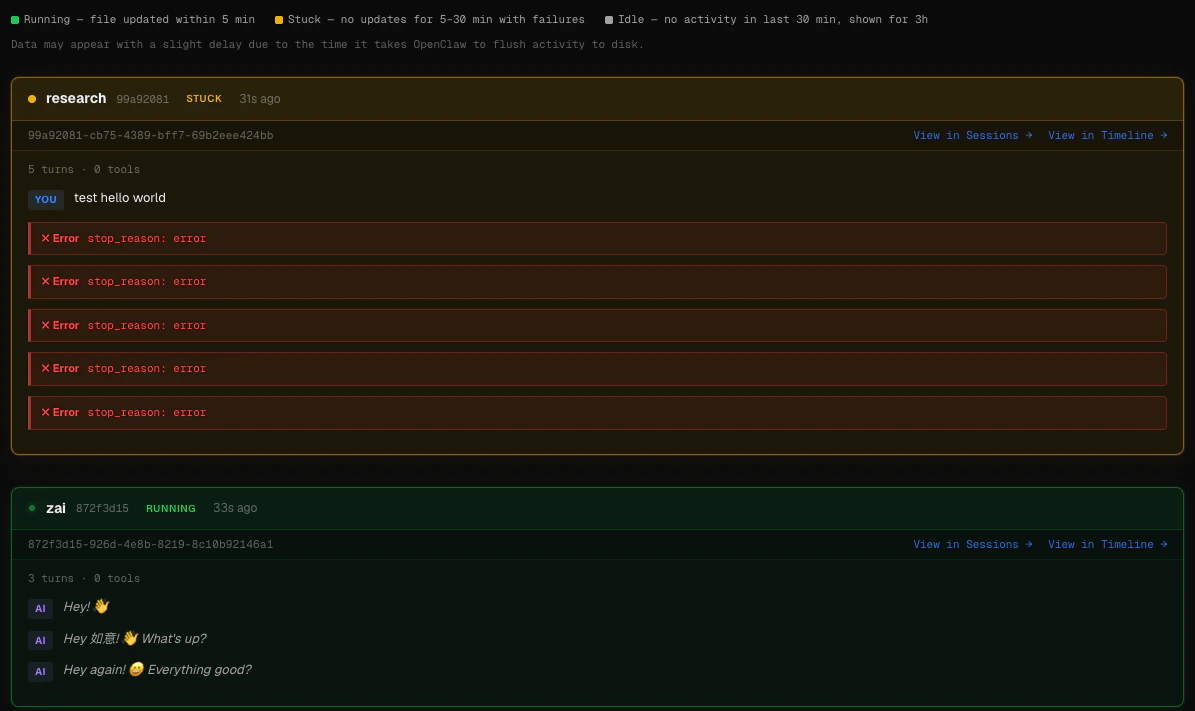
running | Green | The session file was modified within the last 30 minutes and there are no recent tool failures or error stop reasons |
stuck | Amber | The session file was recently modified but the agent has had recent tool failures, or the last message ended with stop_reason: error or stop_reason: max_tokens |
idle | Gray | No file activity for 30 minutes or more; the session is shown at reduced opacity |
Session cards
Each active session is rendered as a card. The card header shows:- Status dot — pulsing green (running), solid amber (stuck), or dim gray (idle)
- Agent name — the name of the OpenClaw agent
- Session ID — the full UUID, with the first 8 characters shown in the header for quick identification
- Status badge —
RUNNING,STUCK, orIDLEin matching color - Idle time — how long ago the session last had activity (e.g.
2m 14s ago,1h 5m ago) - Last tool — the most recently called tool, if any
- View in Sessions — opens the Sessions browser with this session pre-selected
- View in Timeline — opens the Session Timeline for a detailed message-by-message breakdown
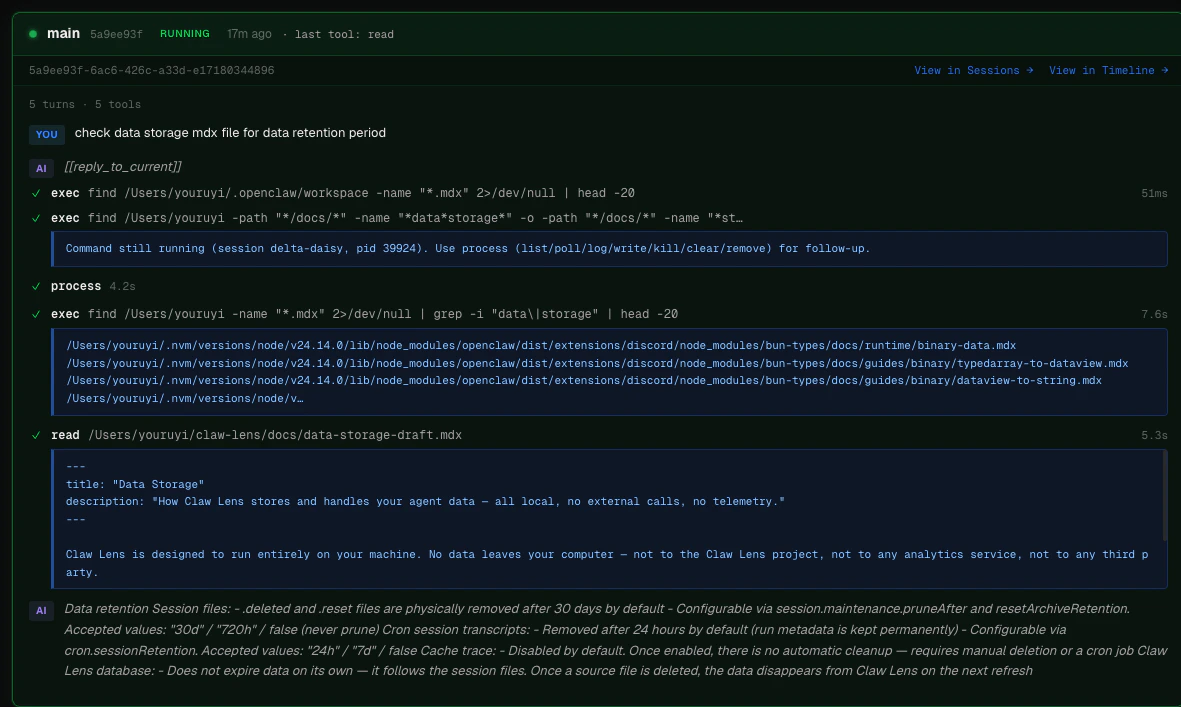
Step-by-step trace
Trace elements
User message
User message
Shown with a blue
YOU label. This is the most recent human message that triggered the current agent turn. Cron prefixes ([cron:...]), Slack routing headers, and system metadata are automatically stripped so you see only the actual task text.Thinking block
Thinking block
When the model produces extended thinking, a collapsible block appears with a purple
thinking label and a character count. Click to expand and read the model’s reasoning. Collapsed by default to keep the trace compact.AI response
AI response
Shown with a purple
AI label. The assistant’s text response for that turn, italicized.Tool call
Tool call
Each tool invocation appears as a row with:
- A green
✓(success) or red✗(failure) indicator - The tool name in bold
- A preview of the key argument — Claw Lens checks for
command,path,file_path,url,query,expression,pattern,old_string, orcontentand shows the first non-empty value, truncated to 90 characters - The duration of the tool call (e.g.
1.4s,230ms) - A result preview — the first 500 characters of the tool output, shown in a dark code block
Error stop
Error stop
When a turn ends with
stop_reason: error, the error text is highlighted in a red bordered block. This is the most common indicator that an agent is stuck.Waiting / done indicators
Waiting / done indicators
- Waiting: shown when the session is still open and the last step was a user message or tool call — the agent is waiting for the model to respond
- Done: shown when the session completed normally with
stop_reason: end_turn
When no sessions are active
If no sessions have had file activity in the last 3 hours, the page shows:All quiet Updates automatically when agents become active.The page continues polling every 5 seconds in the background. As soon as an agent starts a new session, the card appears without requiring a page reload.