npx claw-lens-cli to start the dashboard at http://localhost:4242. No account, no API key, no external service — everything runs on your machine. Available in both English and Simplified Chinese.
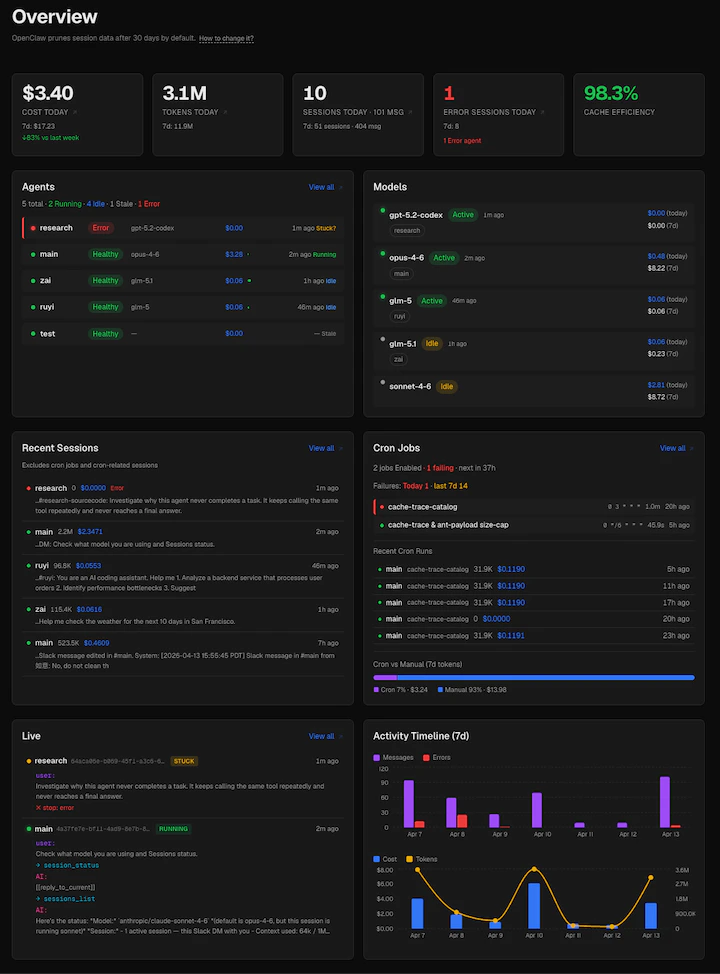
You type a prompt. Your agent runs for five minutes. What is it doing?
You see the final output — but not the tool calls, the retries, or the tokens it burned to get there. Right now, running an AI agent feels like flying blind.Live Monitor
Watch your agents work in real time. See which agent is running, what tool it just called, whether it’s stuck in a loop — streamed live over WebSocket, not polled from logs. Every message, every tool call, every result, as it happens.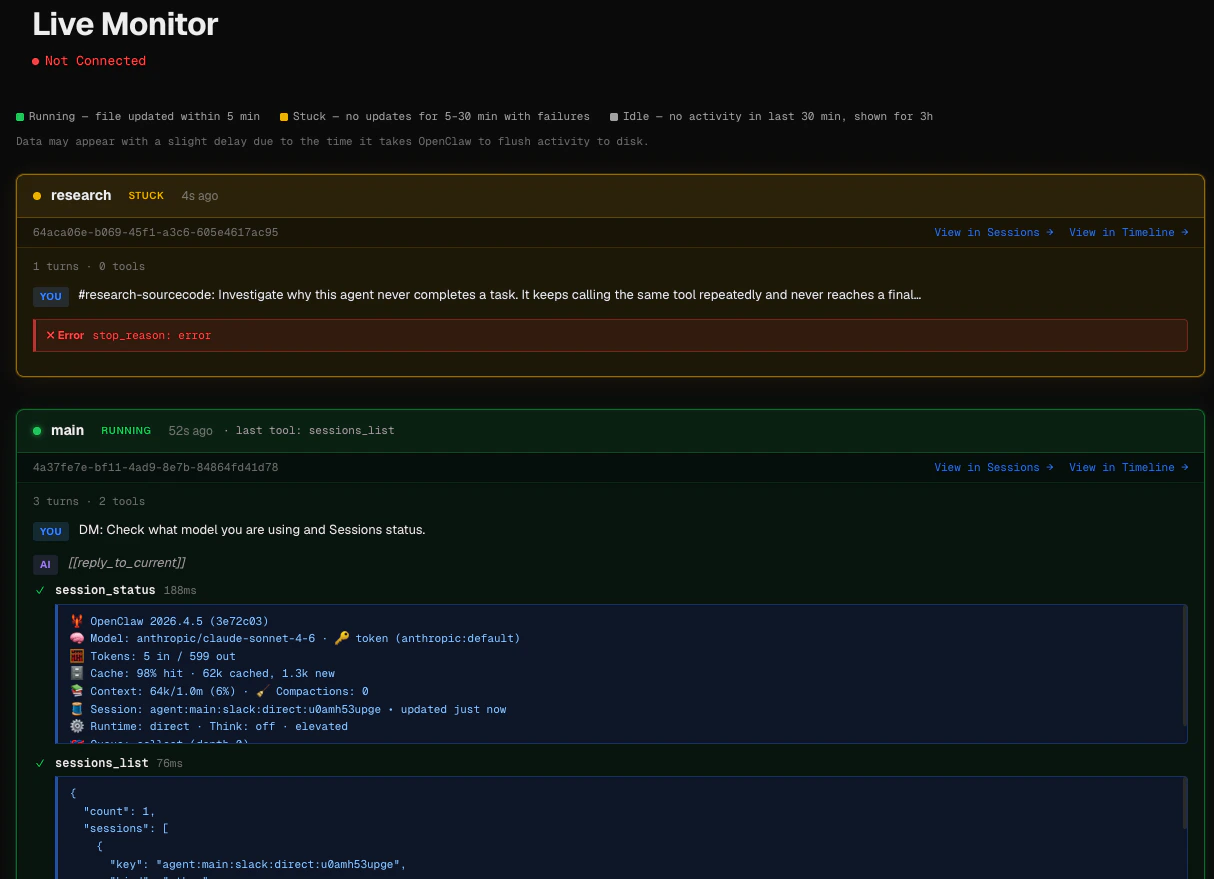
Cost & Token Analytics
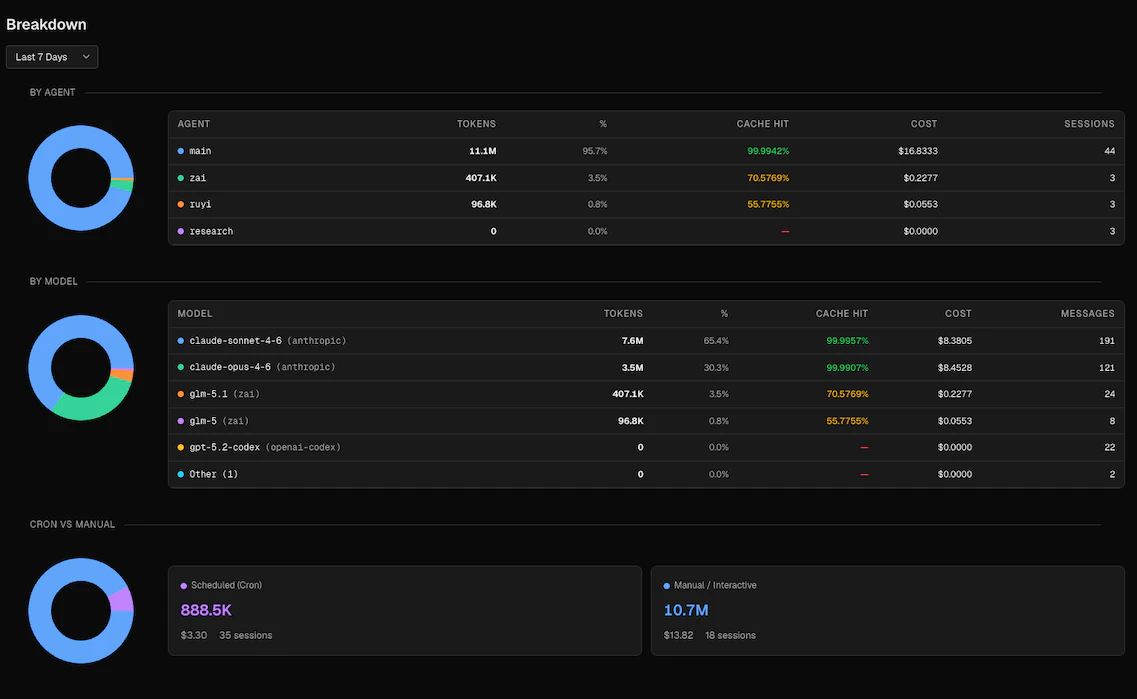
Track spend by day, by model, and by agent. See cache hit rates, cost-per-session breakdowns, and token composition across any time range. When a session costs more than expected, drill into the per-agent breakdown to find out where the tokens went.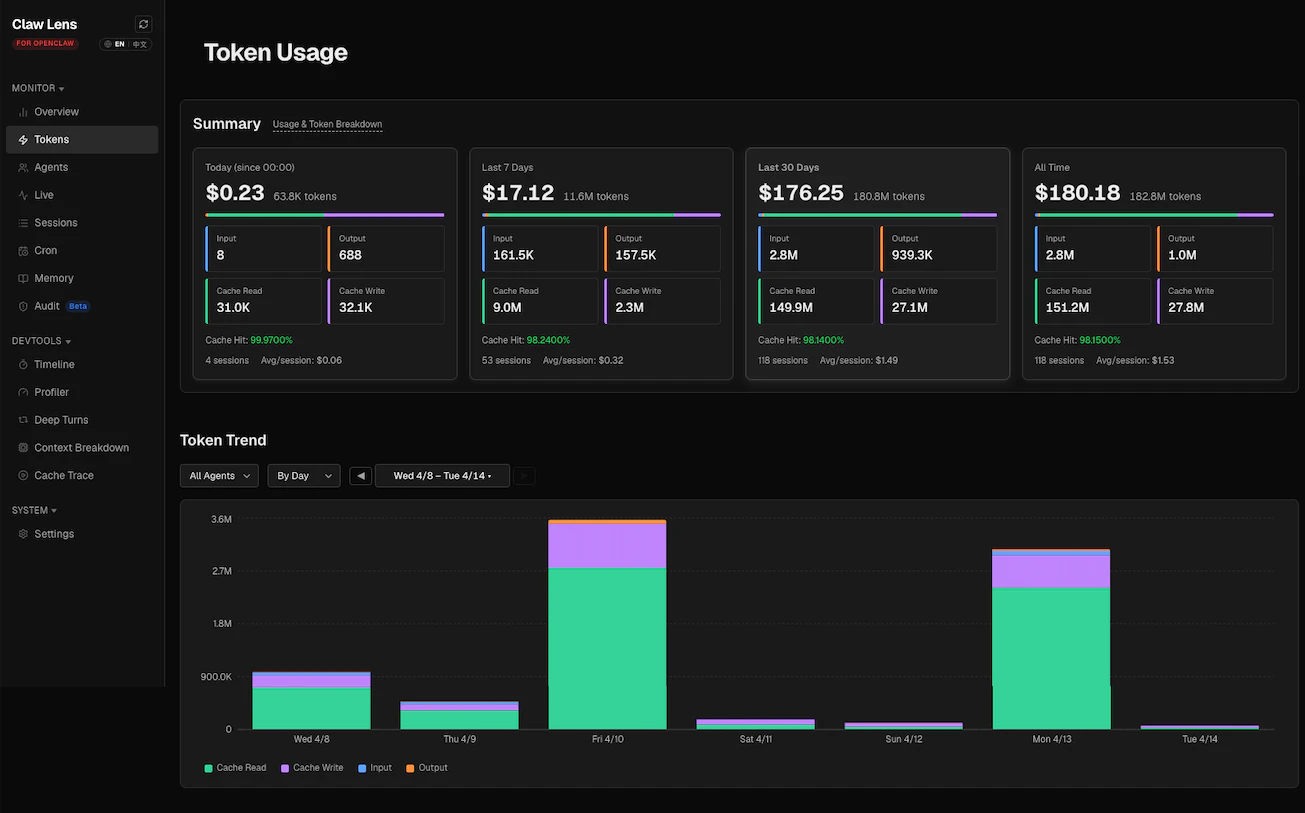
Sessions
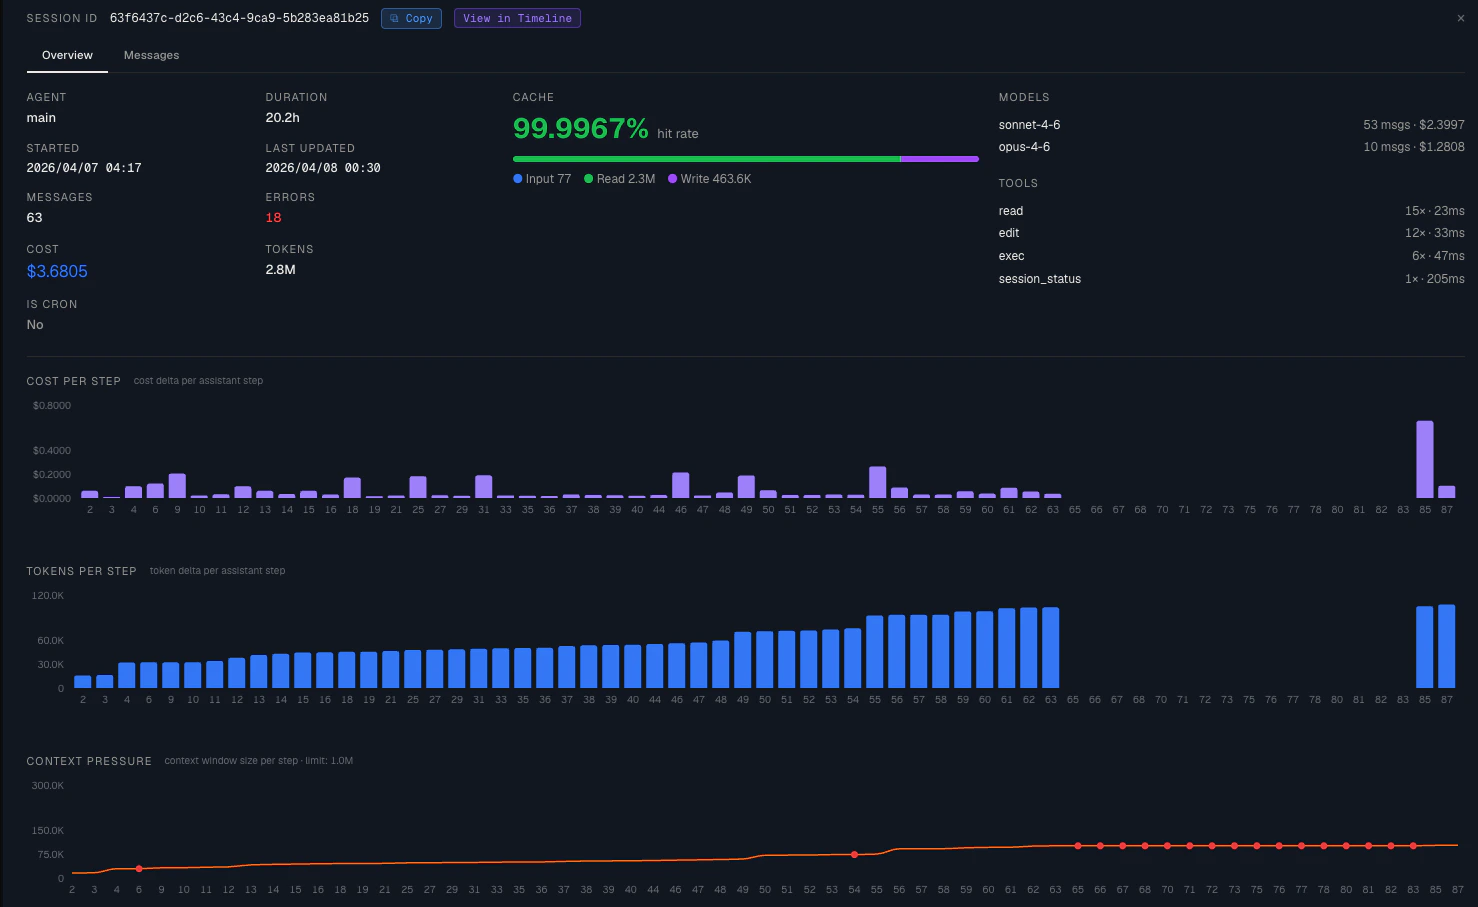
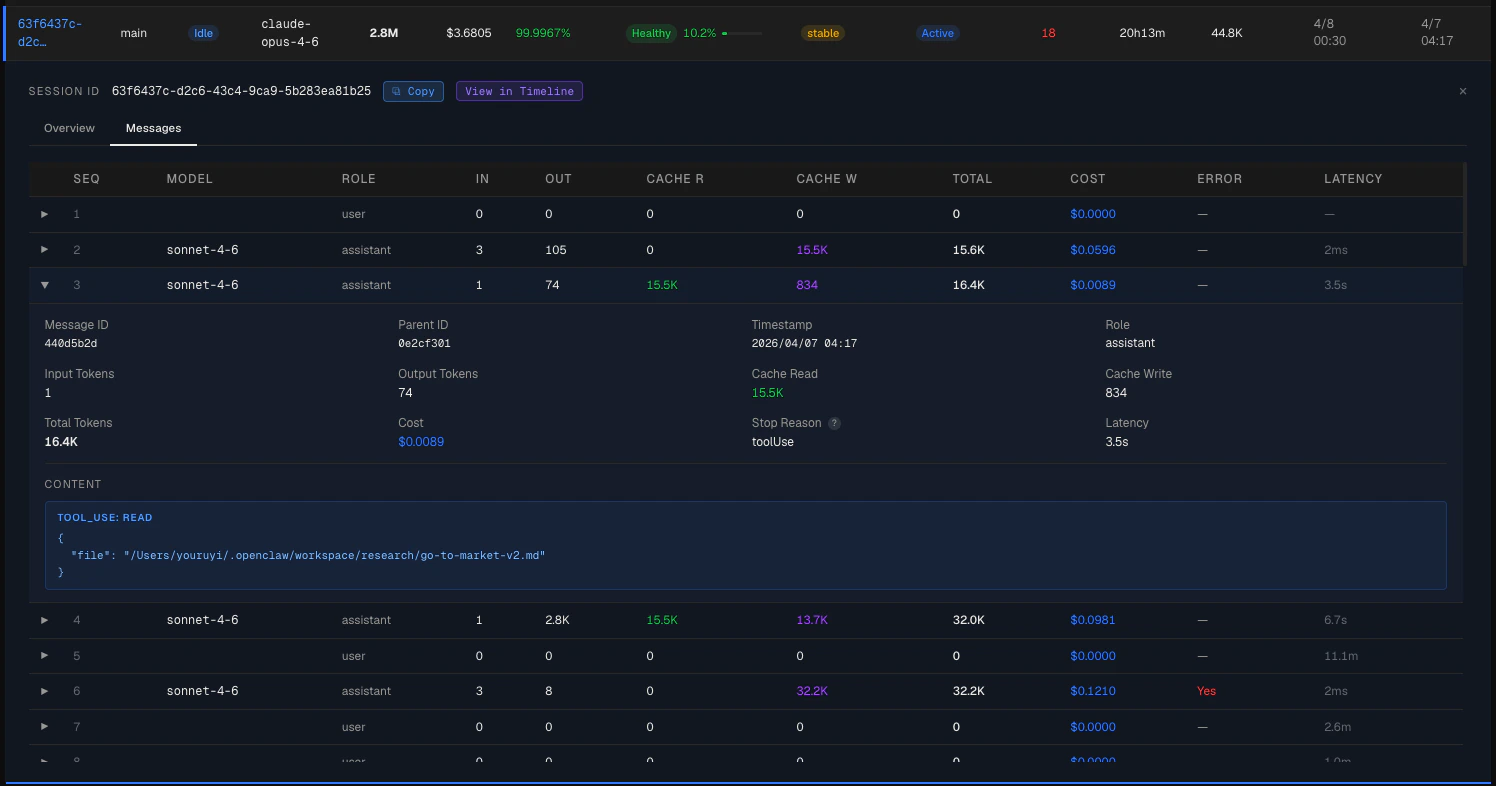
Browse every session in one filterable table — model, tokens, cost, cache hit rate, context pressure, burn rate, errors, and activity time at a glance. Filter by agent, time range, or search by session ID.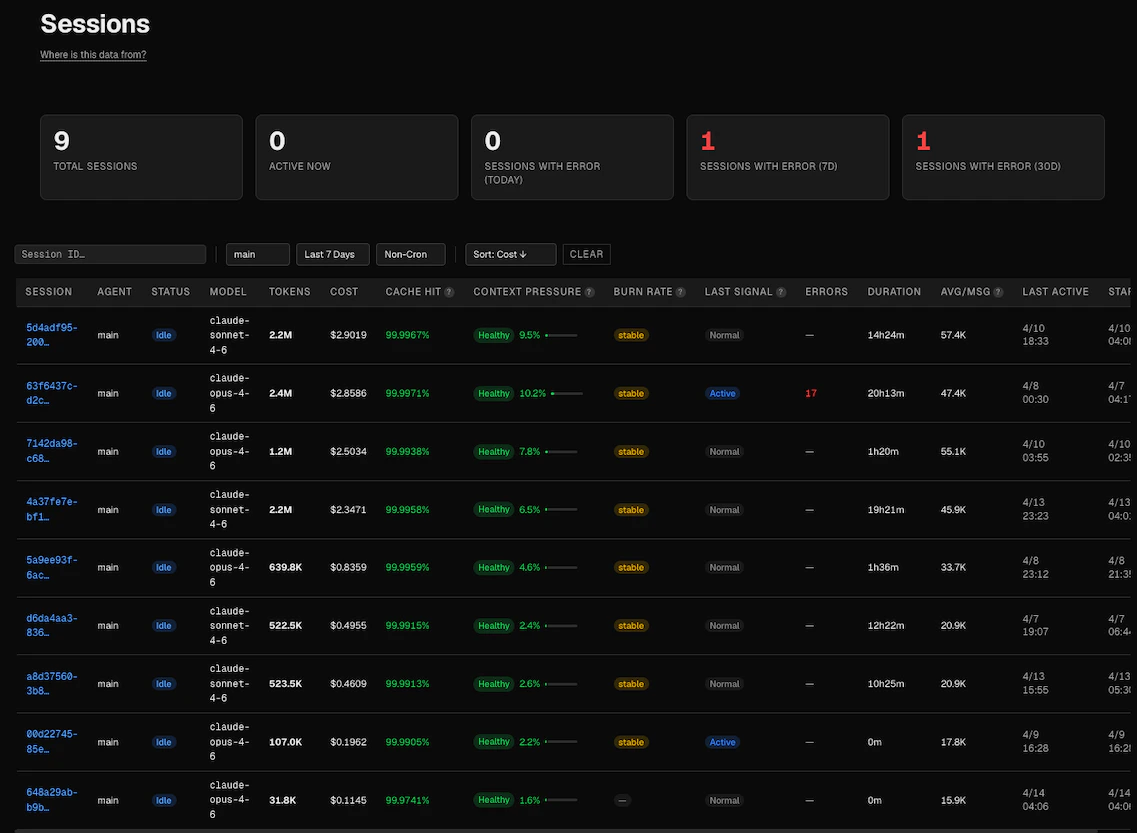
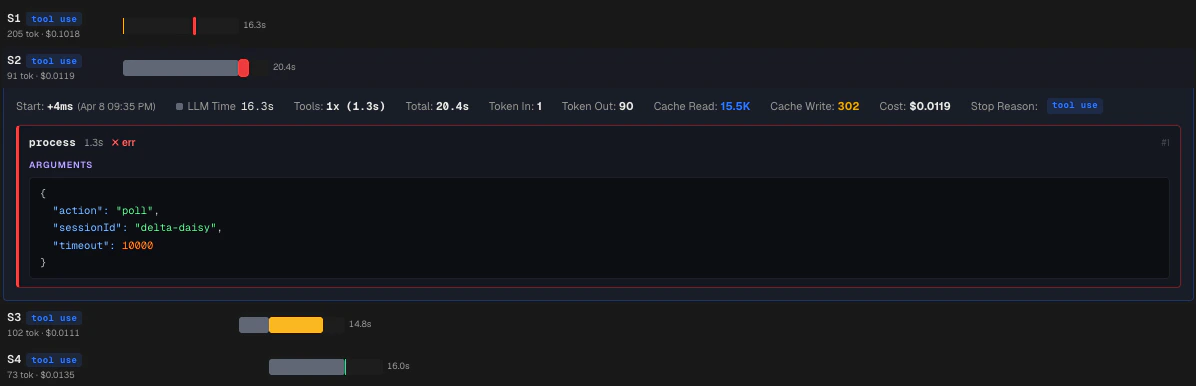
Session Timeline
A Gantt chart of a single session — every LLM call and tool invocation laid out on a time axis. See exactly where time is spent: is it the model thinking, or a tool running slow? Idle gaps are auto-compressed so you focus on what actually happened.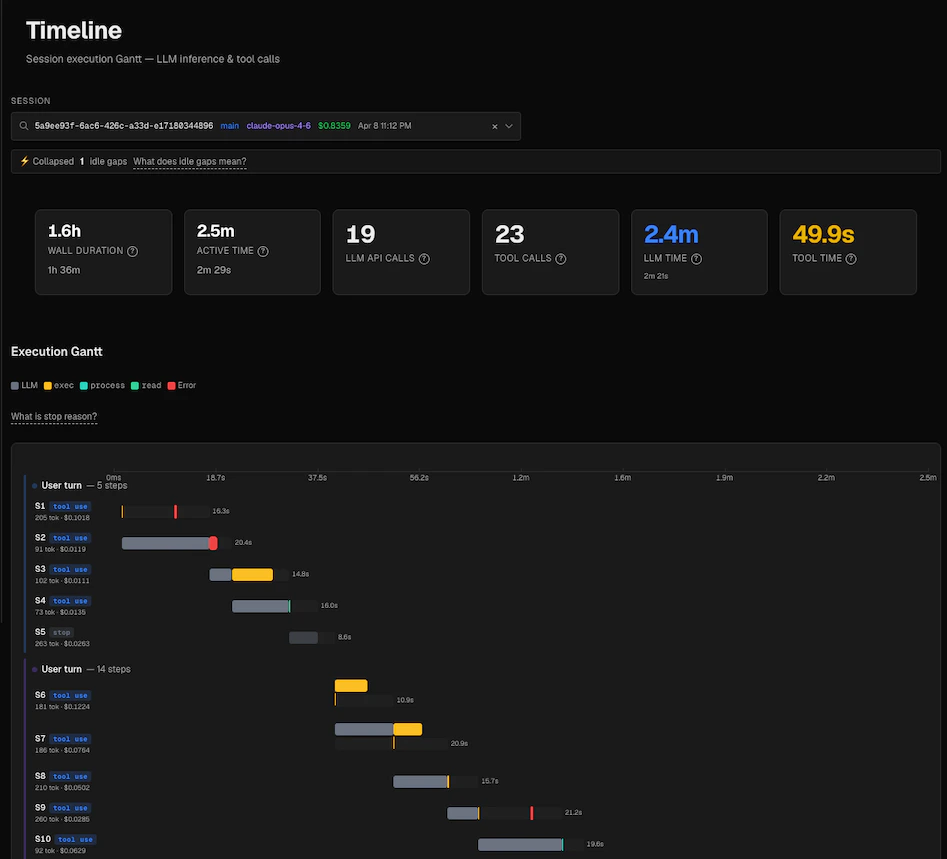
Agents
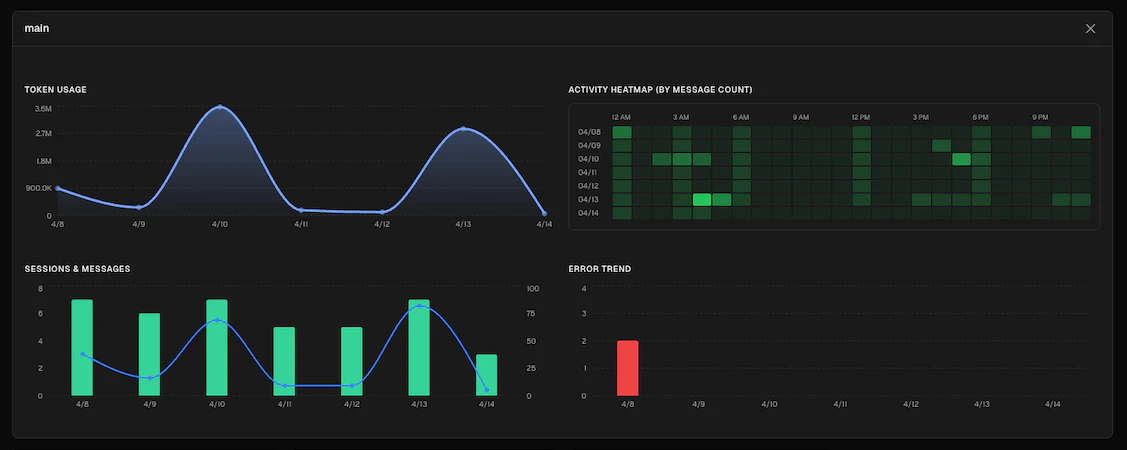
See all your agents at a glance — who’s running, who’s idle, who’s healthy. Each agent card shows health status, current task, model, cost, error rate, cache hit rate, and context pressure.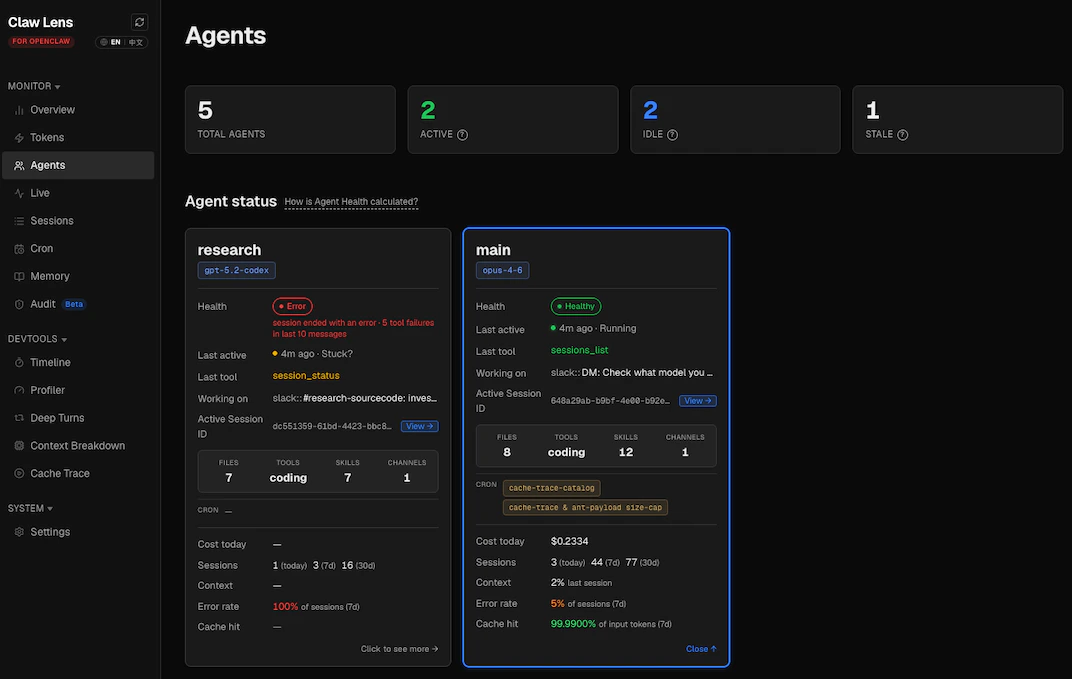
Security Audit
Automatic scanning across every session for credential leaks, prompt injection attempts, dangerous shell commands, and data exfiltration patterns. Each event is risk-scored so you can filter by severity. Includes a per-agent security profile — tool footprint, directory access, network domains, and a trust status.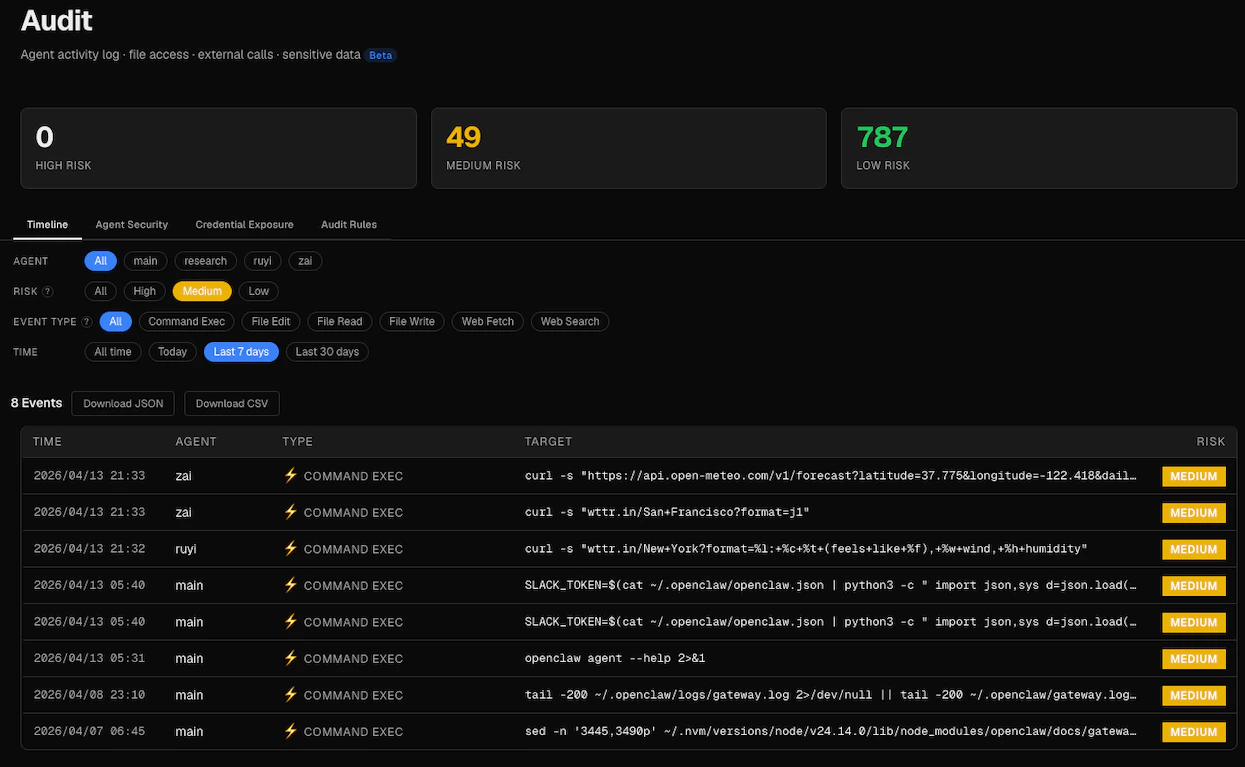
Context Breakdown
Visualize how system prompt, conversation history, and tool results fill up the context window at every API call. See exactly when and where context pressure spikes.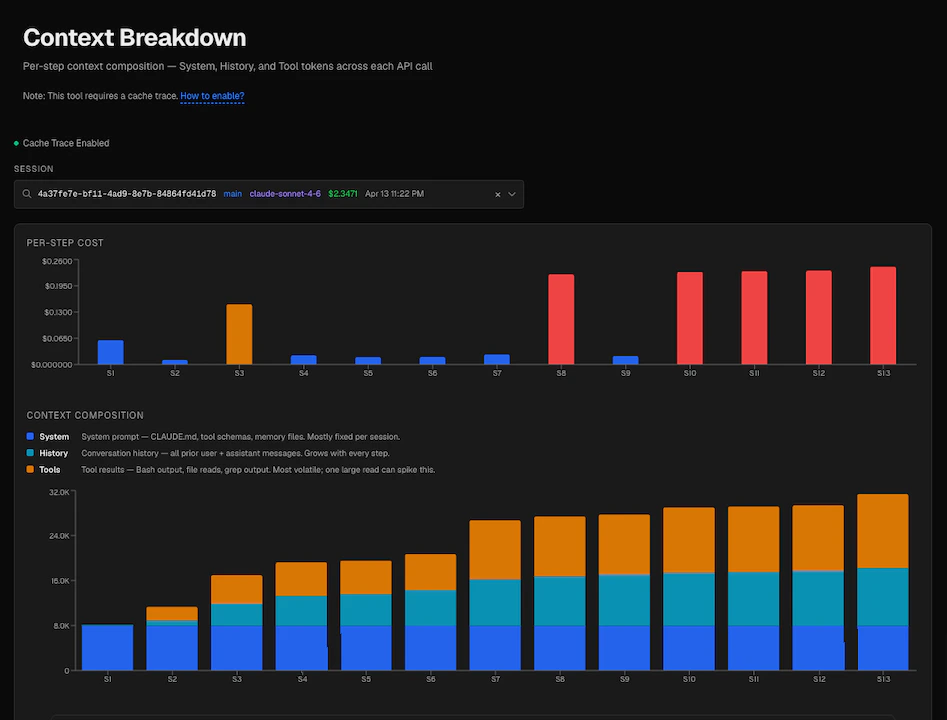
And more
Cron Jobs
Auto-detect scheduled agent runs with full run history — status, duration, and success/failure logs.
Tool Profiler
Latency distribution, failure rates, and slow call identification for every tool your agents use.
Deep Turns
Detect turns with abnormally deep tool-call sequences — the first sign an agent is looping or struggling.
Cache Trace
Pipeline flow visualization and diff between consecutive LLM calls to debug prompt cache misses.
i18n
Full dashboard available in English and Simplified Chinese. Switch anytime from the sidebar.
Adopt a Claw
A little easter egg — find the mascot hiding in settings and adopt it. It comes with different moods.
Get started in 30 seconds
1
Run one command
http://localhost:4242. No config, no signup.2
That's it
Claw Lens auto-detects your OpenClaw home directory and reads agent logs locally. All data stays on your machine.
Requires Node.js 18+. Your OpenClaw agent must have run at least one session to produce log data.
Quick Start
Detailed setup guide and configuration options.
Full Documentation
Explore every feature in depth.