The Context Breakdown page shows you exactly how your agent’s context window is being consumed — step by step, broken down by component. Use it to understand why a session is running out of context, which component is growing the fastest, and where you might be able to reduce token usage.
This page requires cache trace data to be enabled. If cache trace is not active, the page displays an “Unavailable” banner with instructions on how to enable it.
Enabling cache trace
The cache trace status is shown as a colored dot at the top of the page: green when enabled, gray when not.
Two ways to enable it:
Option 1 — add to ~/.openclaw/openclaw.json:
{
  "diagnostics": {
    "cacheTrace": {
      "enabled": true,
      "includeMessages": true,
      "includePrompt": true,
      "includeSystem": true
    }
  }
}
OPENCLAW_CACHE_TRACE to OpenClaw and let it enable the setting for you.
The cache trace file grows quickly. Set up a cron job to clean it periodically, or it will consume significant disk space over time.
Selecting a session
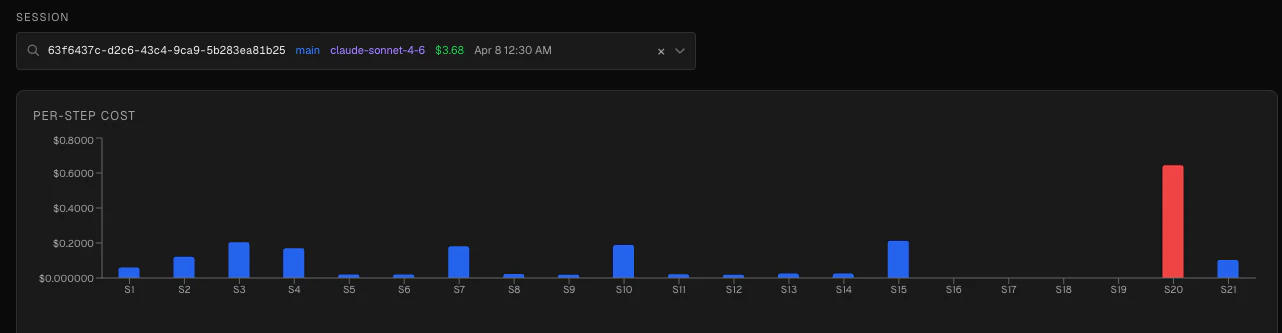
Use the session picker to choose which session to inspect. The dropdown shows the session ID, agent name, model, cost, date, and number of steps for each session. Type to search by any of these fields.
Click × to clear the current selection and return to the empty state.
Per-step cost chart
A bar chart showing the token cost at each step of the session. Bars are color-coded by relative cost:
| Color | Meaning |
|---|
| Red | ≥80% of the maximum step cost — the most expensive steps |
| Amber | ≥50% of the maximum step cost |
| Blue | Below 50% — normal cost |
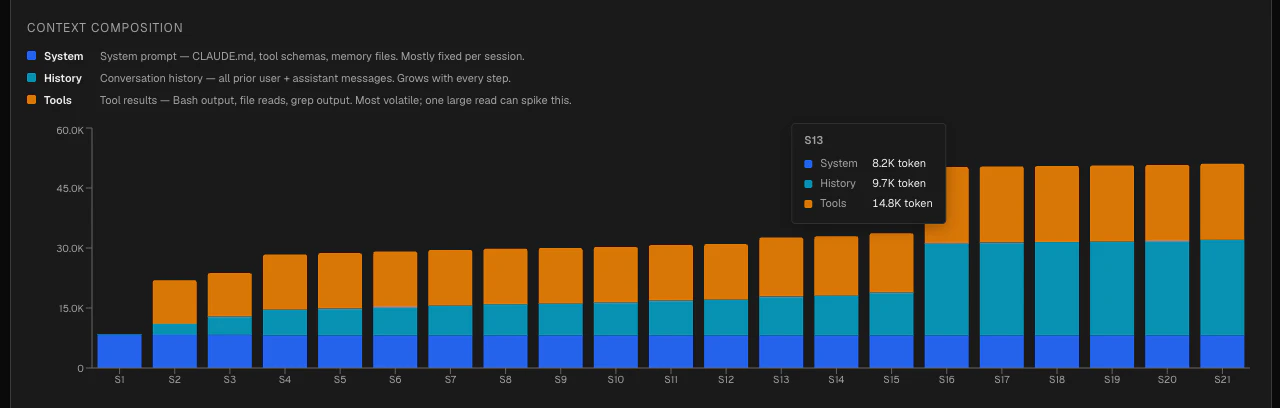
Context composition chart
A stacked bar chart showing how the context window is composed at each step. Three components are tracked:
| Color | Component | Description |
|---|
| Blue | System | The system prompt and instructions |
| Cyan | History | Conversation history — previous messages between the user and agent |
| Amber | Tools | Tool call results and tool-related content |
Per-turn table
A detailed table breaking down the context window at each step:
| Column | Description |
|---|
| Step | The step number in the session |
| System | Tokens consumed by the system prompt |
| History | Tokens consumed by conversation history |
| Tools | Tokens consumed by tool results |
| Total | Total tokens used at this step |
| Pressure | Context utilization as a percentage of the model’s context limit |
| Cost | Token cost for this step (shown only if cost data is available) |