Session scope
By default the profiler shows aggregate stats across all sessions. To narrow the view to a specific run, use the session picker at the top of the page.- Type any part of a session ID or agent name to filter.
- Select All sessions (the first option in the dropdown) to return to the aggregate view.
- The table and all drill-down data update immediately when you change the session filter.
The profiler table
The table lists every tool that has been called at least once, sorted by total time (average duration × timed call count) in descending order. The tool that consumed the most cumulative time appears first.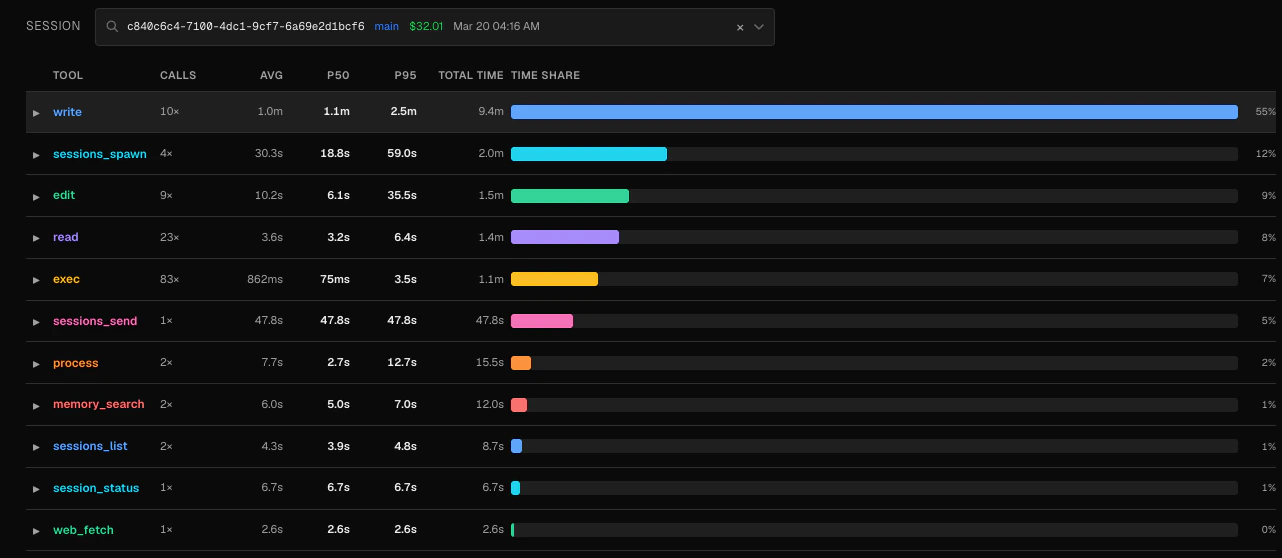
| Column | Description |
|---|---|
| Tool | Tool name as recorded in the session log |
| Calls | Total number of times this tool was called |
| Avg | Mean duration across all calls that have timing data |
| P50 | Median duration — half of calls complete faster than this |
| P95 | 95th-percentile duration — the slowest 5% of calls take at least this long |
| Total time | avg_duration × timed_count — a proxy for total wall-clock time consumed |
| Time share | Percentage of total tool time this tool accounts for, shown as a bar |
Not every call has timing data. The Calls column counts all invocations, while Avg, P50, and P95 are computed only from calls that have a recorded
duration_ms. A large gap between the two suggests some calls are missing timing instrumentation.Drill-down: duration distribution
Click any row to expand a histogram of that tool’s call durations. Duration buckets are fixed: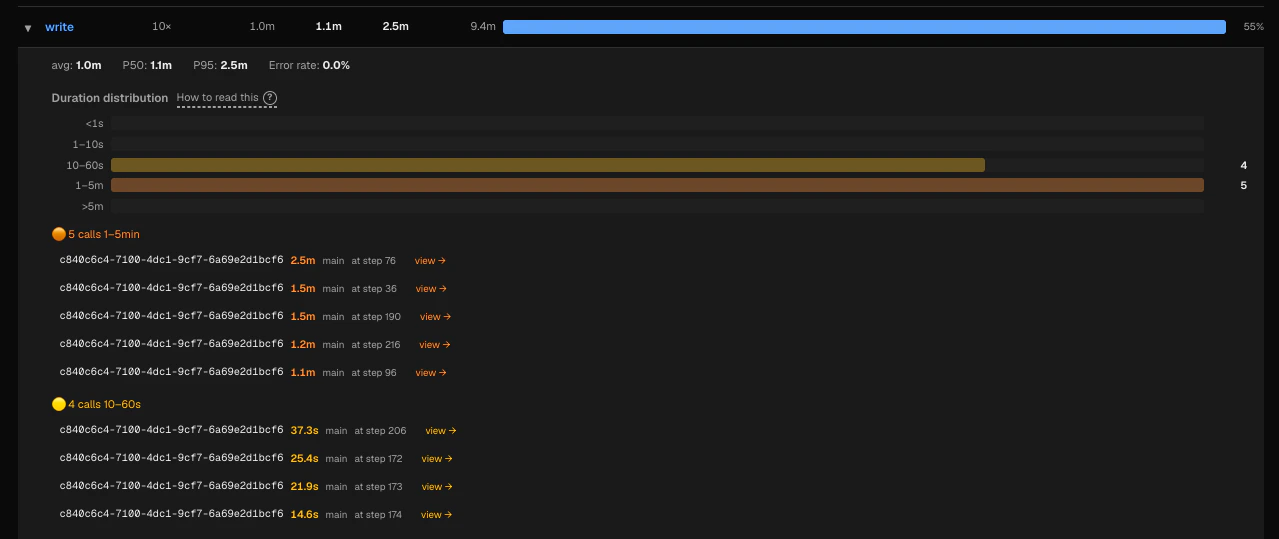
| Bucket | Interpretation |
|---|---|
<1s | Fast — expected for most read/search operations |
1–10s | Normal for web fetches or moderate shell commands |
10–60s | Worth investigating if unexpected |
1–5m | Slow — likely a long-running process or stuck network call |
>5m | Very slow — almost always a problem |
- >5m — the slowest outliers
- 1–5m — significantly slow
- 10–60s — moderately slow
Identifying problems
Slow tools — A high p95 relative to p50 means the tool has a long tail: most calls are fast but occasional calls take much longer. This often points to intermittent network timeouts, large file I/O, or resource contention. Frequently failing tools — The expanded detail panel shows error rate as a percentage. An error rate above a few percent usually means something is consistently wrong: a broken path, a permission error, or an unstable external service. High time share — A tool with a large time-share bar is consuming a disproportionate amount of your agent’s wall-clock time. Even if individual calls are fast, a high call count can make a tool a bottleneck.Example: diagnosing a slow web_fetch
Example: diagnosing a slow web_fetch
Suppose
web_fetch shows a p50 of 800ms but a p95 of 12s. Expanding the row reveals several calls in the 10–60s bucket. Clicking one takes you to the Session Timeline, where the turn detail shows the raw output — a connection timeout to a slow third-party API. You can then add a timeout parameter to your agent’s fetch calls or cache the result.