KPI strip
Five metrics at the top of the page give you a quick health check:Job list
The job table has the following columns:
A job row with a red left border and red outline indicates the last run ended in an error. If the same job has failed multiple times in a row, the consecutive error count appears as
×N in red next to the duration.
Enabling and disabling jobs
Click the toggle switch in the Enabled column to enable or disable a job. The change takes effect immediately. The toggle is disabled while the update is in flight, and an error message appears below the toggle if the update fails.Expanded job detail
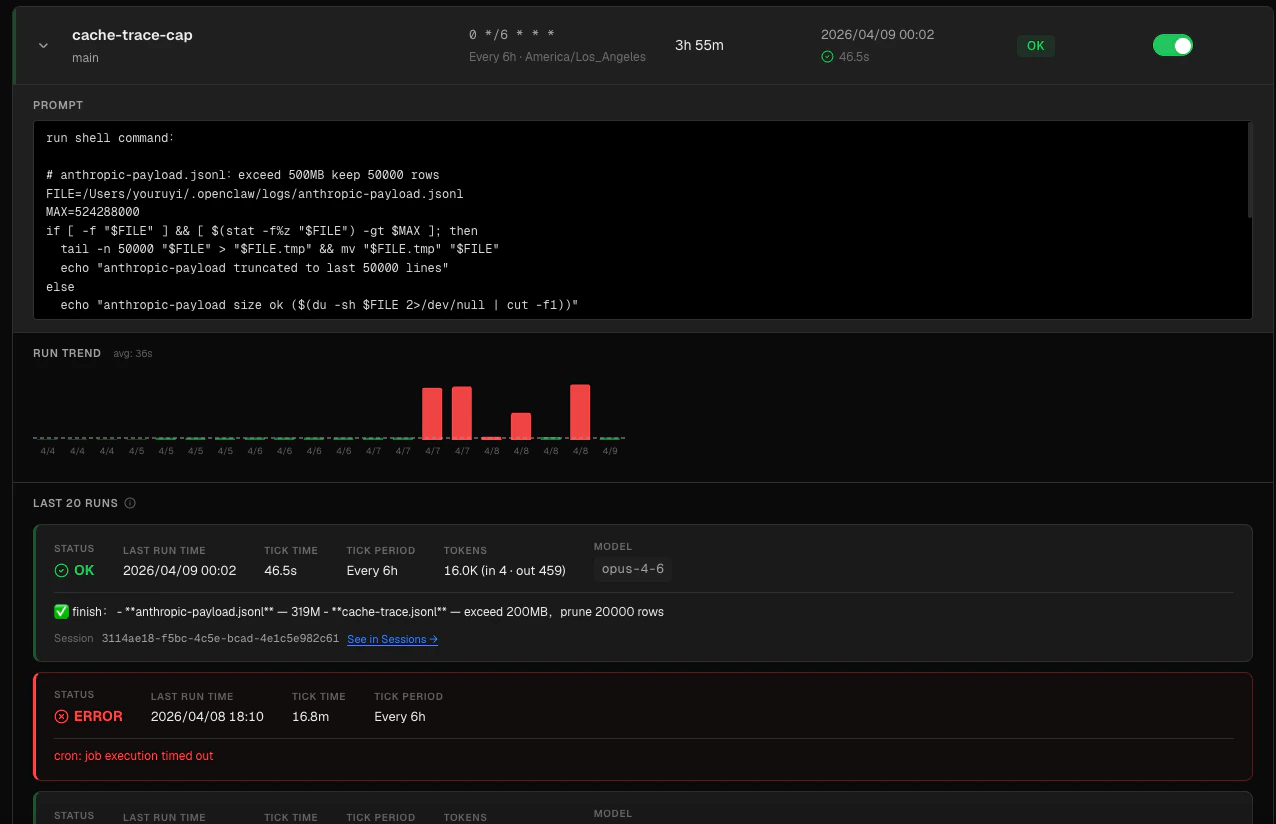
payload.message field.
Run trend chart — a bar chart of the last 20 runs ordered chronologically (oldest left, newest right). Each bar represents one run’s duration in seconds. Green bars are successful runs; red bars are errors. A dashed reference line shows the average duration of successful runs.
Run history — up to 20 most recent runs, each displayed as a card. Each card shows:
- Status —
OK,ERROR, orRUNNINGwith an icon - Run time — when the run started
- Duration — how long the run took
- Token usage — total tokens consumed, with input/output/cache-read/cache-write breakdown
- Model — the model that handled the run (abbreviated)
- Error message — shown in red when the run failed
- Summary — a brief description of what the run did (for successful runs)
- Session link — if the underlying session still exists in the Claw Lens database, a link to view it in the Sessions page
If a session has been pruned from local storage, the session link will not appear in the run card, even though the run record still exists.