The Cache Trace page lets you inspect every LLM API call in a session and understand exactly how the prompt was assembled, what was cached, and why cache misses happen. Use it when you need to understand why a session’s cache hit rate dropped or why costs spiked unexpectedly.
This page requires cache trace data to be enabled. If cache trace is not active, the page displays an “Unavailable” banner with instructions on how to enable it.
Enabling cache trace
The cache trace status is shown as a colored dot at the top of the page: green when enabled, gray when not.
Two ways to enable it:
Option 1 — add to ~/.openclaw/openclaw.json:
{
  "diagnostics": {
    "cacheTrace": {
      "enabled": true,
      "includeMessages": true,
      "includePrompt": true,
      "includeSystem": true
    }
  }
}
OPENCLAW_CACHE_TRACE to OpenClaw and let it enable the setting for you.
The cache trace file grows quickly. Set up a cron job to clean it periodically, or it will consume significant disk space over time.
Selecting a session
Use the session picker to choose which session to inspect. The dropdown shows the session ID, agent name, model, cost, and timestamp for each session. Type to search by any of these fields. Click × to clear the selection.
Run cards
Each LLM API call in the session is displayed as a collapsible run card. By default, the page shows the first 30 runs — click “Show all runs” to load every run in the session.
The collapsed card header shows a summary of the API call at a glance:
| Element | Description |
|---|
| Sequence number | The order of this API call in the session (#1, #2, #3, …) |
| Timestamp | When the API call was made |
| Model | The model used for this call |
| Steps badge | Number of processing steps in this call. Highlighted in amber when there are many steps. |
| Dropped messages badge | Shown in red when messages were dropped during context assembly to fit the model’s context window |
| Cost | Token cost for this API call |
| Tokens | Total token count for this call |
| Session key | The session identifier |
Pipeline flow
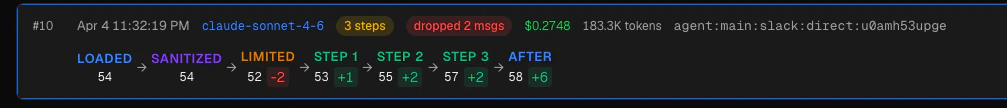
Below the header summary, each run card shows a pipeline flow visualization — a horizontal sequence of stages showing how the context was assembled for this API call:
LOADED → SANITIZED → LIMITED → STEP 1 → STEP 2 → ... → AFTER
| Stage | Color | What it does |
|---|
| Loaded | Blue | Raw conversation history loaded from the session file on disk |
| Sanitized | Purple | Cleanup pass — removes invalid tool calls, fixes malformed content, strips empty messages. A negative delta here means invalid messages were removed. |
| Limited | Amber | Context-window enforcement — if messages exceed the model limit, the oldest are dropped to fit. A negative delta here (shown in red) means messages were dropped to stay within the context window. |
| Step 1, 2, … | Green | Each step where context is sent to the model API. A positive delta means new messages were added (e.g. the model’s response and tool results). |
| After | Blue | Final message count after the model’s reply and any tool results are appended. |
Expanded run detail
Click any run card to expand it and see the full detail. The expanded view contains multiple collapsible sections:
Run ID and system digest
At the top of the expanded view:
- Run ID — unique identifier for this API call
- System digest — SHA256 hash of the system prompt. If this hash changes between consecutive runs, the prompt cache is invalidated and you pay full input token cost. A stable digest means caching is working.
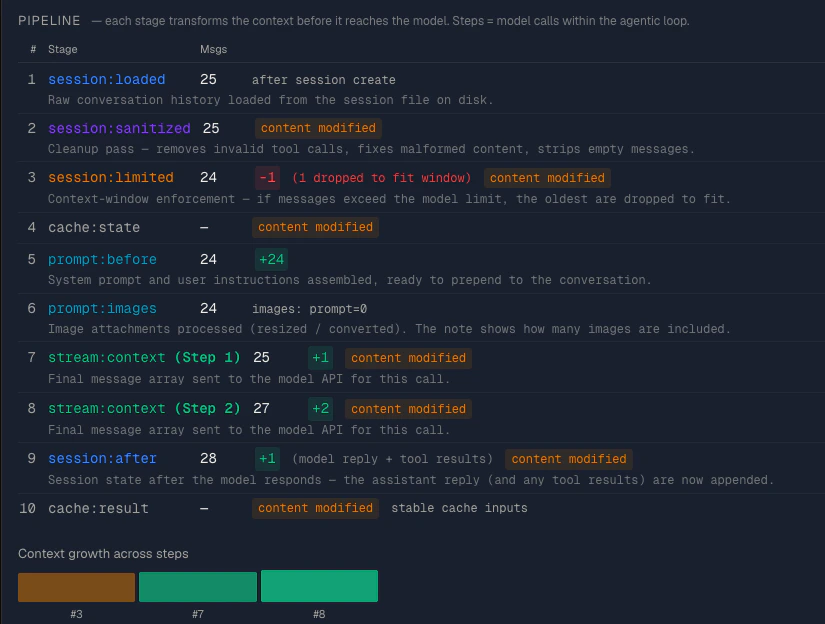
Pipeline detail table
A detailed table listing every pipeline stage with columns:
| Column | Description |
|---|
| # | Sequence number of the stage |
| Stage | The pipeline stage name (e.g. session:loaded, session:sanitized) |
| Msgs | Number of messages at this stage |
| Delta | Change from the previous stage, with annotations |
- “N invalid msgs removed” — shown at the sanitized stage when malformed messages were cleaned up
- “N dropped to fit context” — shown in red at the limited stage when messages were dropped
- “model reply + tool results” — shown at the after stage when new messages were added
- “content modified” — shown in amber when the content hash changed at a stage, indicating the messages were altered (not just added/removed)
Below the table, a context growth bar chart visualizes how the message count changes across steps, with the limited stage as a baseline.
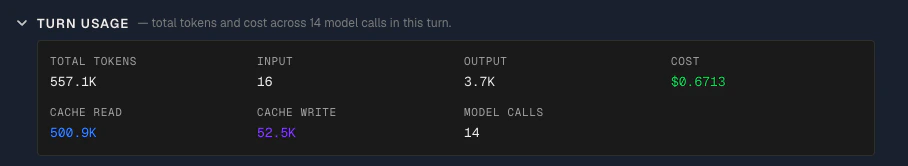
Turn usage
A grid showing the token breakdown for this API call:
- Total tokens, input tokens, output tokens
- Cache read tokens (blue), cache write tokens (purple)
- Cost
- Number of model calls
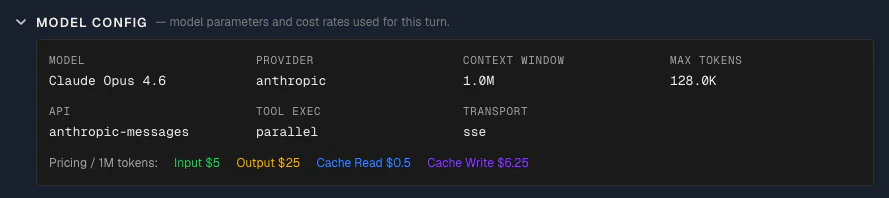
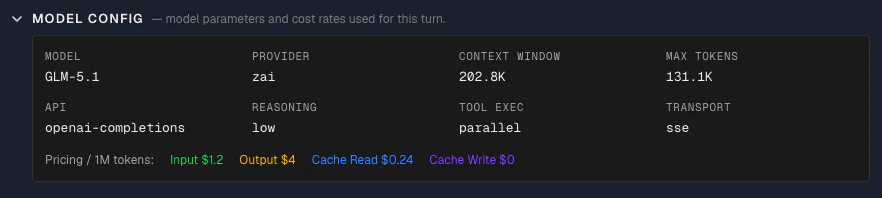
Model config
Collapsed by default. Shows the model configuration used for this call:
- Model: The model name as sent to the API
- Provider: The LLM provider handling the request
- Context window size: The maximum number of tokens this model can accept as input
- Max tokens: The maximum number of tokens the model is allowed to generate in its response
- API: The API protocol used to communicate with the provider (e.g.
messages, chat-completions) — this determines how the prompt is formatted and sent
- Reasoning mode: The reasoning mode, if enabled (e.g.
enabled, disabled) — controls whether the model uses extended thinking
- Tool execution mode: How tool calls are handled (e.g.
client-side, server-side)
- Transport: The connection method used to send the request (e.g.
sse, rest)
Below the grid, a pricing row shows the per-million-token cost for each token type: input, output, cache read, and cache write. These rates come directly from OpenClaw’s model configuration — specifically, the options.model.cost field recorded in the cache trace at the time of each API call. Claw Lens displays them as-is; it does not maintain its own pricing table. This lets you verify exactly what rate was applied when calculating costs for this session.
Note: OpenClaw’s pricing is also an estimate. For exact rates, refer to the model provider’s official pricing page — e.g. Anthropic API pricing or OpenAI API price. Use this to roughly compare pricing across models — you don’t always need the most expensive model. Choose based on your task requirements, model capabilities, and budget.
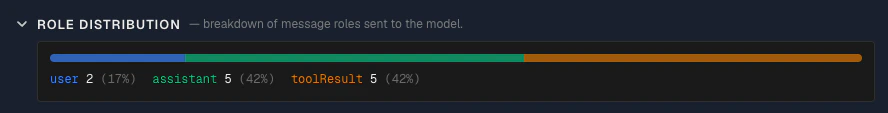
Role distribution
A colored bar showing the proportion of messages by role:
- User (blue) — user messages
- Assistant (green) — model responses
- Tool result (amber) — tool call results
- Other (gray) — any other message types
Each role shows its count and percentage. Use this to understand the composition of the context — a session dominated by tool results suggests the agent is reading a lot of data.
User prompt
The user prompt for this API call, shown as plain text with a copy button. The subtitle shows the estimated token count.
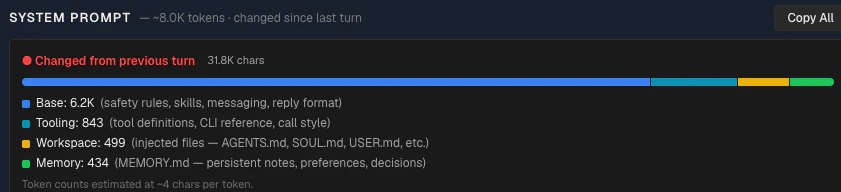
System prompt
The full system prompt with three key features:
Token bar — a horizontal bar breaking the system prompt into four categories by estimated token count:
- Base — safety rules, skills, messaging format, reply format
- Tooling — tool definitions, CLI reference, call style
- Workspace — injected files (AGENTS.md, SOUL.md, USER.md, etc.)
- Memory — MEMORY.md content (persistent notes, preferences, decisions)
Use the token bar to identify which part of the system prompt is consuming the most space. A large Workspace or Memory segment suggests opportunities to reduce context usage.
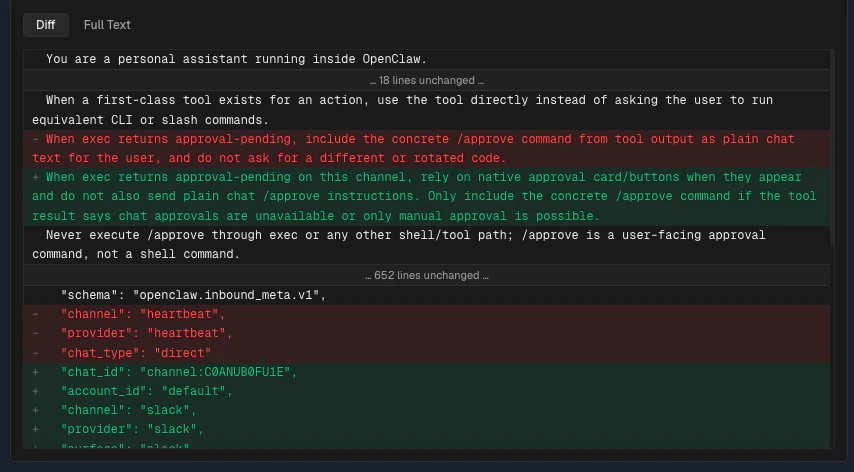
DiffView — when the system prompt changed, a Diff tab appears showing a side-by-side comparison with the previous run. Additions are highlighted in green, removals in red. Unchanged sections are collapsed. This tells you exactly what changed and caused the cache miss — common culprits include timestamps injected into the prompt, dynamic tool lists, or memory files updated mid-session.
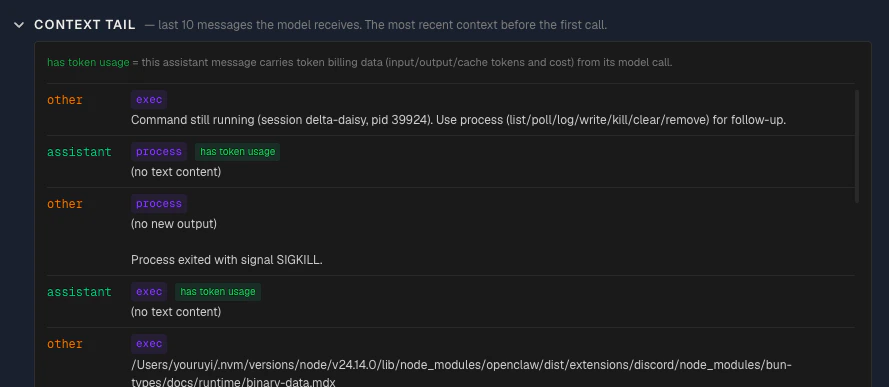
Context tail
Collapsed by default. Shows the last N messages in the context sent to the model. Each message displays:
- Role — color-coded (user in blue, assistant in green, tool_result in amber)
- Tool name — shown as a purple badge when the message is a tool result
- Token usage indicator — a green badge when the message has token usage data attached. Messages with a green “token usage” badge are LLM responses that carry actual token counts (input, output, cache read, cache write). Messages without the badge — such as user messages and tool results — are context inputs that don’t generate their own token billing.
- Text preview — truncated content of the message
What to look for
Cache misses with a changed system digest — the most common cause of unexpected cost. Open the DiffView to see exactly what changed. Common culprits: timestamps injected into the system prompt, dynamic tool lists that change between calls, or memory files that were updated mid-session.
Cache misses with an unchanged system digest — the system prompt is the same, but caching still failed. This usually means the conversation history changed in a way that broke the cache prefix — for example, a message was dropped or reordered during context assembly. Check the pipeline flow and the dropped messages badge.
Large negative deltas at the Limited stage — messages are being dropped to fit the context window. The agent is losing earlier conversation history, which can lead to degraded performance or repeated work.
Rising token cost with stable content — if the prompts look similar but cost keeps climbing, check the turn usage section. The conversation history grows naturally as the session progresses, but a sudden jump often means large tool outputs were injected into the context.
Empty state
If no cache trace data is available for the selected session, the page shows a “No cache trace data” message. If cache trace is not enabled at all, an unavailable banner appears with instructions on how to enable it.