The Session Timeline gives you a turn-by-turn view of a single OpenClaw agent session. Each row in the chart represents one LLM call (a turn), and colored bars inside it show the LLM latency and each tool call side-by-side. You can expand any turn to read the full user prompt, the assistant’s response, and the raw input/output of every tool that ran.
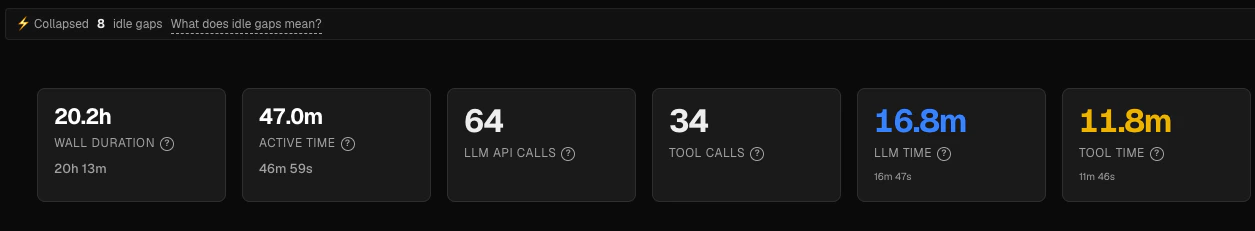
KPI strip
At the top of the page, a strip of six metrics summarizes the selected session:
| Metric | What it measures |
|---|
| Wall duration | Real elapsed time from session start to finish, including all idle gaps |
| Active time | Compressed duration — only the time the agent was actually working |
| LLM API calls | Total number of turns (one per LLM request) |
| Tool calls | Total number of tool calls across all turns |
| LLM time | Sum of all LLM inference latency across every turn |
| Tool time | Sum of parallel-aware wall-clock tool execution time across every turn |
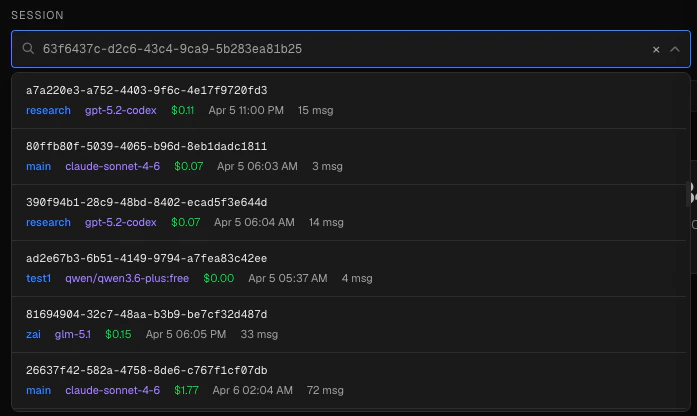
Selecting a session
Use the session picker below the page title to choose which session to inspect.
- Type any part of a session ID or agent name to filter the list.
- The dropdown shows the full session ID, agent name, primary model, total cost, and end time for each session.
- You can paste a complete UUID directly into the input — the picker will auto-select the matching session.
- Click × to clear the current selection and return to the empty state.
The session ID is also reflected in the page URL (?session=<id>), so you can bookmark or share a direct link to any session.
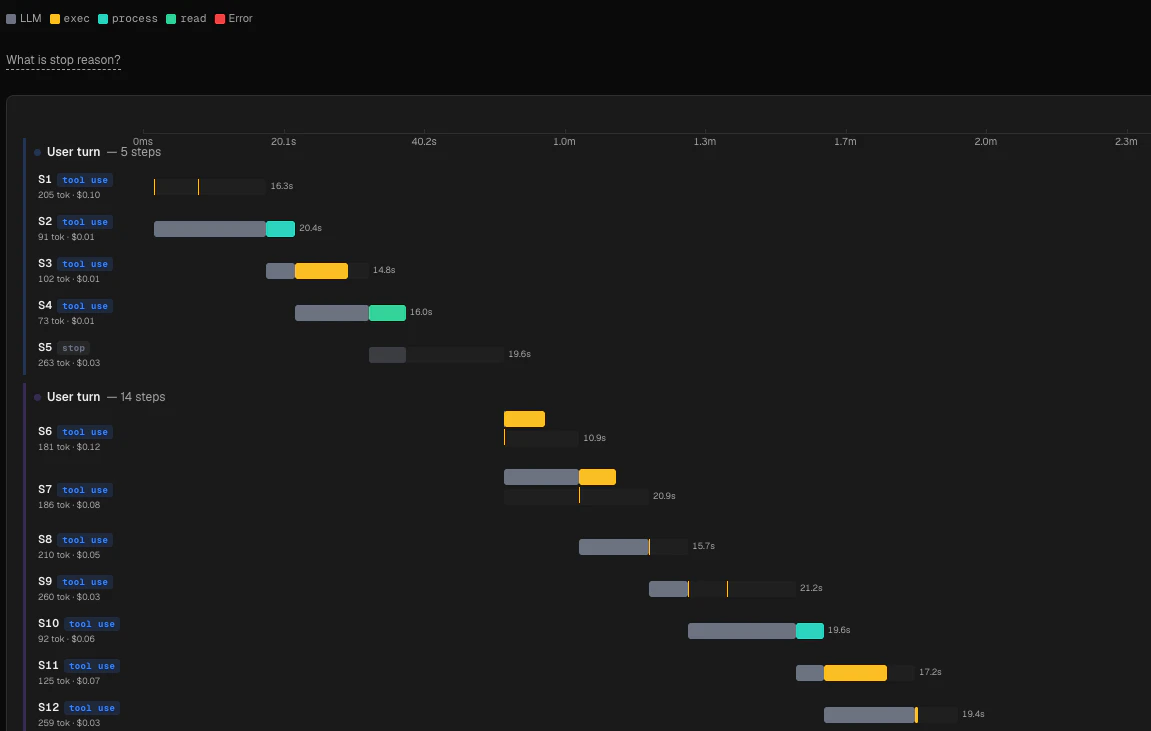
The Gantt chart
The chart uses compressed time on its horizontal axis. The axis is divided into 8 evenly spaced tick marks that span the session’s active duration.
Compressed vs wall-clock time
Idle gaps — periods where the agent was waiting for user input or doing nothing — are collapsed out of the chart. The notice bar above the chart tells you how many gaps were compressed. The Wall duration KPI shows the true elapsed time, while Active time shows the compressed duration used for chart positioning.
Wall-clock timestamps are preserved in the expanded turn detail view (shown as ”+ elapsed” from session start). The compression only affects chart positioning.
Turns (rows)
Each row represents one assistant turn, labeled S1, S2, and so on. The row label also shows:
- Total tokens for that turn and its cost
- A stop reason pill — see below for what each value means
A gray background bar spans the full turn duration. Inside it:
- A dark gray segment at the left edge represents LLM inference time.
- Colored segments represent individual tool calls, positioned at their actual compressed start time.
Click any row to expand it and see the full turn detail.
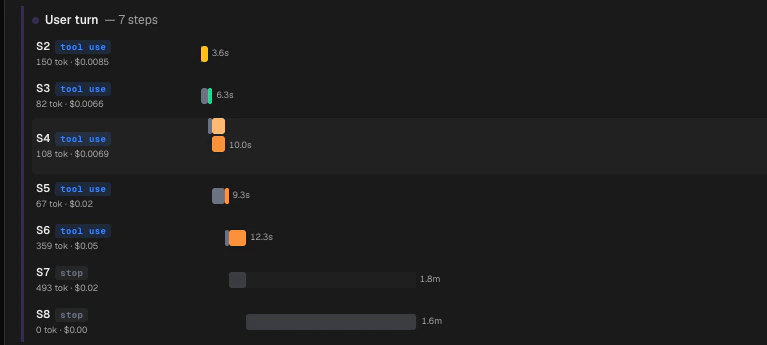
Stop reasons
Each turn ends with one of five stop reasons, shown as a colored pill next to the sequence number:
| Pill | Meaning |
|---|
stop | Model finished naturally (equivalent to Anthropic end_turn or OpenAI stop) |
toolUse | Model requested a tool call — the turn continues |
length | Response was cut off by the max_tokens limit |
error | An API, network, or provider error occurred |
aborted | The run was cancelled via an abort signal |
A length stop reason means the model ran out of output tokens and its response may be incomplete. Check the turn’s token counts if you see this.
Color legend
The legend above the chart shows a swatch for each tool that appeared in the session. The following built-in tools have fixed colors:
exec / Bash — amberread / Read — greenwrite / Write — purpleedit / Edit — cyanweb_fetch / WebFetch — orangeweb_search / WebSearch — peachsessions_spawn / Agent — pink
Failed tool calls are always shown in red regardless of the tool type.
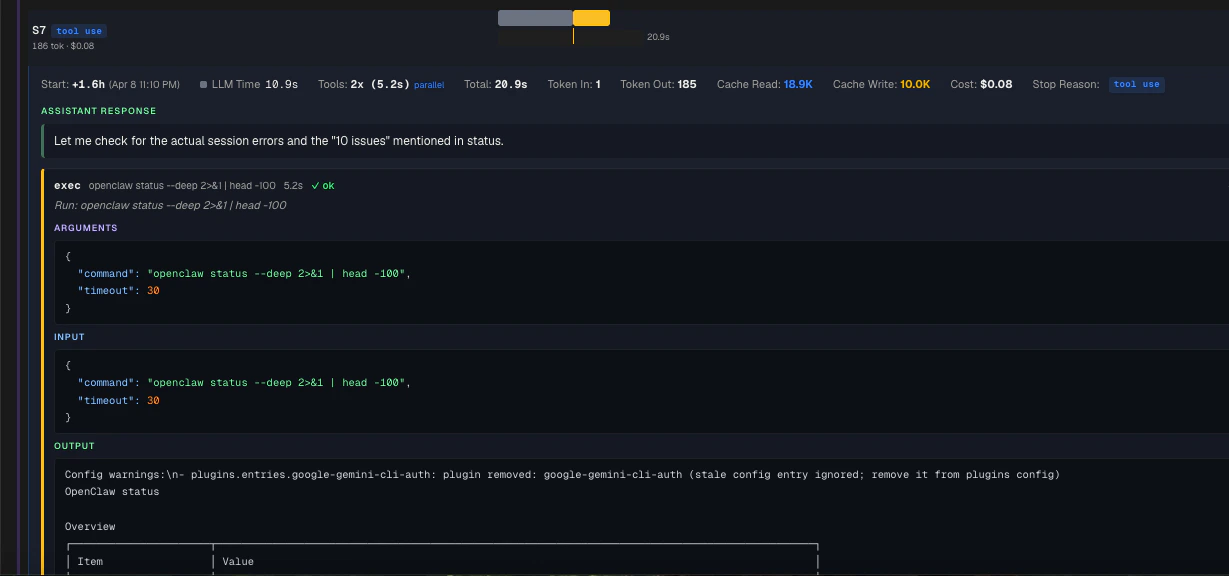
Turn detail
Click any turn row to expand its inline detail panel. The panel shows:
Timing summary
- Wall-clock start time (offset from session start, with an absolute timestamp)
- LLM inference time
- Number of tool calls and their parallel-aware wall-clock span
- Total turn duration
- Whether parallel execution was detected
Token counts
- Input tokens
- Output tokens
- Cache read tokens (shown in blue when present)
- Cache write tokens (shown in amber when present)
- Turn cost
Stop reason — repeated with a colored pill, plus the parsed error message if the stop reason was error.
Message context — the text of the user message that triggered this turn, and the assistant’s text response. These are fetched live from the session log.
Each tool call in the turn renders as its own card with a colored left border. The card shows:
- Tool name and target path or URL (when available)
- Duration and success/failure status
- A natural-language summary for common tools (
exec, read, write, edit, web_search, web_fetch)
- Arguments — the parsed JSON input the model passed to the tool
- Raw input and raw output — the exact bytes sent and received, pretty-printed if valid JSON
If a tool call is red in the chart, open its card in the expanded turn detail to read the raw output — the error message is usually there.
Navigating from other pages
Several other Claw Lens pages link directly into the Session Timeline with a specific turn pre-selected:
- The Tool Profiler links slow calls to the turn in which they occurred.
- The Deep Turn page links deep turns directly to the timeline with the turn highlighted.
When you arrive via a direct link, the target turn is automatically expanded and highlighted with a blue outline for five seconds.