> ## Documentation Index
> Fetch the complete documentation index at: https://claw-lens.com/llms.txt
> Use this file to discover all available pages before exploring further.
# Sessions
> The Sessions browser lists every recorded agent session with token counts, costs, errors, and context health, and lets you drill into per-session details including model breakdown, tool usage, and message-level charts.
The Sessions page is a searchable, sortable table of every agent session Claw Lens has recorded. You can filter by agent, time range, and session type, then click any row to expand a full detail panel for that session.
Session data is read from the OpenClaw agent session files stored under `~/.openclaw/agents/{agent}/sessions/`.
***
## KPI strip
The five KPIs at the top of the page summarize the currently visible session set:
| Metric | Description |
| ------------------ | -------------------------------------------------------------- |
| **Total sessions** | Number of sessions matching the current filters |
| **Active now** | Sessions with a message in the last 10 minutes |
| **Errors today** | Sessions started today that contain at least one error message |
| **Errors 7d** | Error-containing sessions in the last 7 days |
| **Errors 30d** | Error-containing sessions in the last 30 days |
Error counts are shown in red when non-zero.
***
## Filtering and sorting
Use the controls above the table to narrow down the session list:
Type any part of a session UUID into the search box. This filter bypasses all other filters and matches across all loaded sessions.
Select an agent from the dropdown to show only sessions for that agent.
Choose **Today**, **Last 7 days**, **Last 30 days**, or **All time**. When a time filter is active, token counts and costs are recalculated to include only messages within that window.
Choose **All sessions**, **Cron only**, or **Non-cron** to isolate scheduled vs. interactive sessions.
Sort by **Newest** (last activity), **Tokens**, **Cost**, **Errors**, or **Cache hit (ascending)**.
Click **Clear** to reset all filters at once.
***
## Sessions table
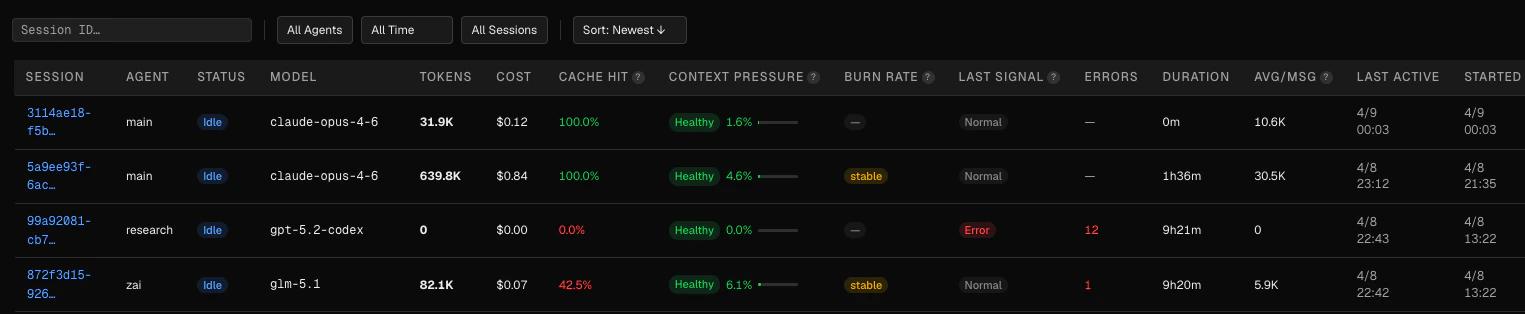 Each row in the table represents one session. The columns are:
| Column | Description |
| -------------------- | --------------------------------------------------------------------------------------------------------------------- |
| **Session** | First 12 characters of the session UUID, in blue monospace |
| **Agent** | Name of the OpenClaw agent |
| **Live status** | `running` (message in last 30 min) or `idle` |
| **Model** | Primary model used in the session |
| **Tokens** | Total tokens across all messages |
| **Cost** | Total cost for the session |
| **Cache hit** | `cache_read / (cache_read + input_tokens)` — colored green ≥ 80 %, amber ≥ 50 %, red below 50 % |
| **Context pressure** | How full the context window was in the last assistant message: healthy (0–69 %), warning (70–89 %), critical (≥ 90 %) |
| **Burn rate** | Direction of context growth across the last 3 messages: `rising` (red), `stable` (amber), `cooling` (green) |
| **Last signal** | The last `stop_reason` from the final assistant message |
| **Errors** | Number of error messages in the session; shown in red when non-zero |
| **Duration** | Wall-clock time from session start to last message |
| **Avg per msg** | Average tokens per assistant message |
| **Last active** | Timestamp of the most recent message |
| **Started** | Session start timestamp |
### Last signal values
| Signal | Meaning |
| ---------- | ------------------------------------------------------------- |
| Normal | `stop` or `end_turn` — session completed normally |
| Error | `error` — the agent encountered an unrecoverable error |
| Aborted | `aborted` — the run was cancelled |
| Max tokens | `max_tokens` — the context window was exhausted |
| Active | `tool_use` — the agent is mid-turn, waiting for a tool result |
***
## Cron vs manual sessions
Each row in the table represents one session. The columns are:
| Column | Description |
| -------------------- | --------------------------------------------------------------------------------------------------------------------- |
| **Session** | First 12 characters of the session UUID, in blue monospace |
| **Agent** | Name of the OpenClaw agent |
| **Live status** | `running` (message in last 30 min) or `idle` |
| **Model** | Primary model used in the session |
| **Tokens** | Total tokens across all messages |
| **Cost** | Total cost for the session |
| **Cache hit** | `cache_read / (cache_read + input_tokens)` — colored green ≥ 80 %, amber ≥ 50 %, red below 50 % |
| **Context pressure** | How full the context window was in the last assistant message: healthy (0–69 %), warning (70–89 %), critical (≥ 90 %) |
| **Burn rate** | Direction of context growth across the last 3 messages: `rising` (red), `stable` (amber), `cooling` (green) |
| **Last signal** | The last `stop_reason` from the final assistant message |
| **Errors** | Number of error messages in the session; shown in red when non-zero |
| **Duration** | Wall-clock time from session start to last message |
| **Avg per msg** | Average tokens per assistant message |
| **Last active** | Timestamp of the most recent message |
| **Started** | Session start timestamp |
### Last signal values
| Signal | Meaning |
| ---------- | ------------------------------------------------------------- |
| Normal | `stop` or `end_turn` — session completed normally |
| Error | `error` — the agent encountered an unrecoverable error |
| Aborted | `aborted` — the run was cancelled |
| Max tokens | `max_tokens` — the context window was exhausted |
| Active | `tool_use` — the agent is mid-turn, waiting for a tool result |
***
## Cron vs manual sessions
 Sessions triggered by a cron schedule are automatically tagged. You can distinguish them using:
* The **Cron only** filter in the filter bar
* The **Cron** field in the detail panel, which shows the cron task name when applicable
Scheduled sessions appear in the Cron Jobs panel on the Overview page and in the Token Usage cron vs manual breakdown.
***
## Session detail panel
Click any row to expand an inline detail panel for that session. The panel has two tabs.
Sessions triggered by a cron schedule are automatically tagged. You can distinguish them using:
* The **Cron only** filter in the filter bar
* The **Cron** field in the detail panel, which shows the cron task name when applicable
Scheduled sessions appear in the Cron Jobs panel on the Overview page and in the Token Usage cron vs manual breakdown.
***
## Session detail panel
Click any row to expand an inline detail panel for that session. The panel has two tabs.
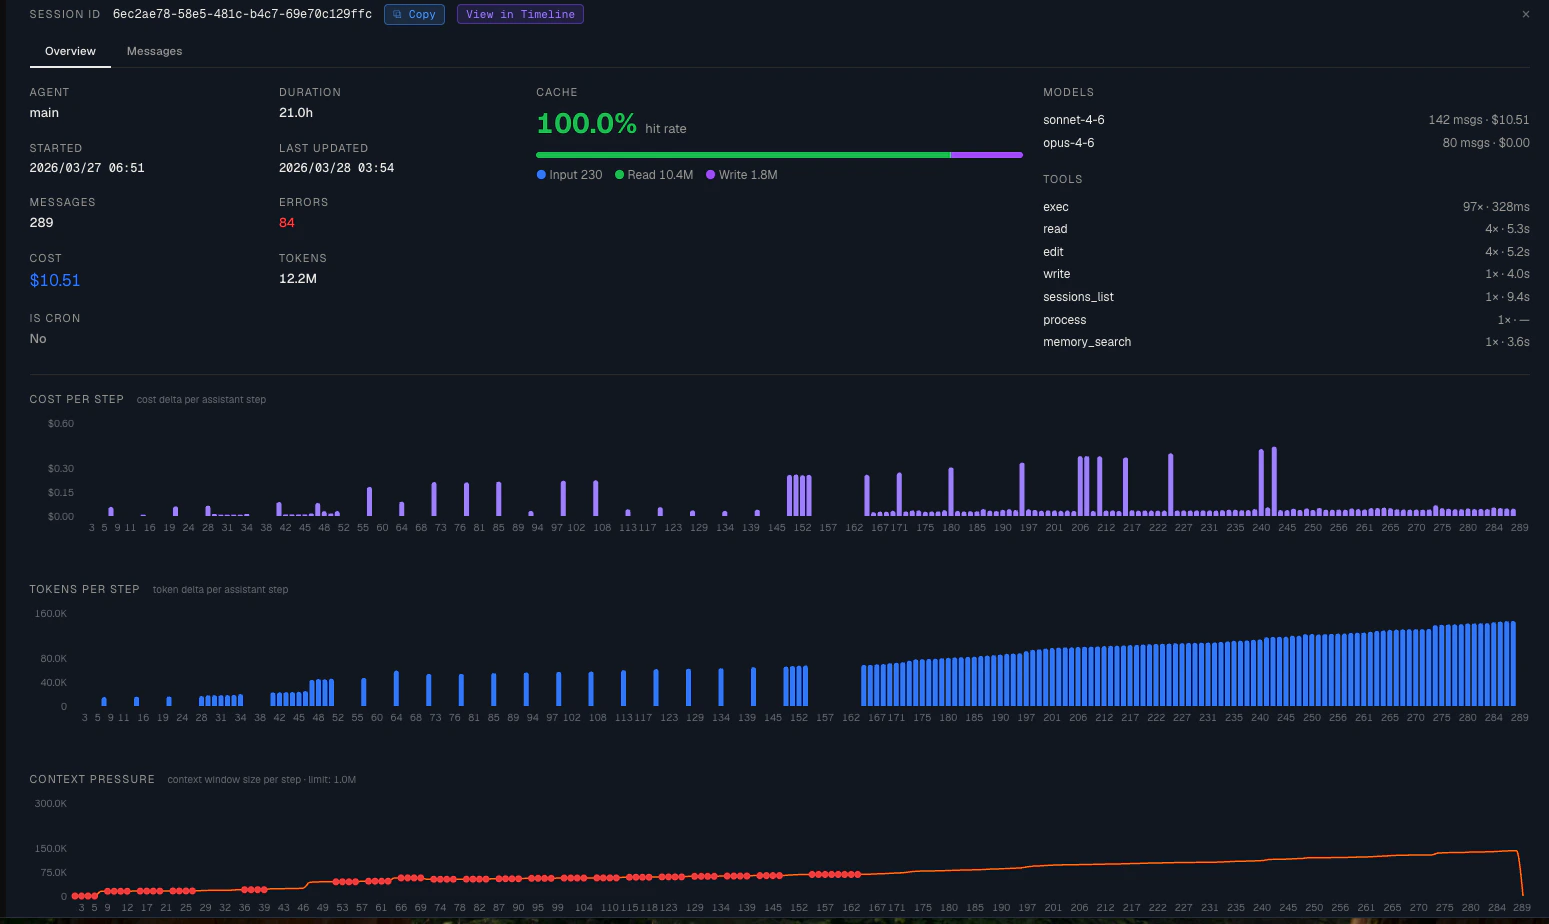 ### Overview tab
The Overview tab is divided into three columns:
**Column 1 — Session stats**
* Agent name, duration, start time, last updated
* Message count, error count, total cost, total tokens
* Whether the session is a cron session (and which cron task, if applicable)
**Column 2 — Cache breakdown**
A horizontal bar showing the proportion of token types: input (blue), cache read (green), cache write (purple). Below the bar:
* Cache hit rate as a large percentage (green ≥ 80 %, amber ≥ 50 %, red below 50 %)
* Exact token counts for each type
**Column 3 — Models and tools**
* Per-model message count and cost
* Per-tool call count and average duration
**Charts**
Below the three-column section, three stacked charts provide a per-step view of the session:
A bar chart of cost per assistant message, ordered by sequence number. Useful for spotting expensive individual turns.
A bar chart of total tokens per assistant message. Rising bars indicate the context window is filling up.
A line chart of context window usage over time, with reference lines at 70 % (amber) and 100 % (red). Error steps are marked with red dots.
### Messages tab
### Overview tab
The Overview tab is divided into three columns:
**Column 1 — Session stats**
* Agent name, duration, start time, last updated
* Message count, error count, total cost, total tokens
* Whether the session is a cron session (and which cron task, if applicable)
**Column 2 — Cache breakdown**
A horizontal bar showing the proportion of token types: input (blue), cache read (green), cache write (purple). Below the bar:
* Cache hit rate as a large percentage (green ≥ 80 %, amber ≥ 50 %, red below 50 %)
* Exact token counts for each type
**Column 3 — Models and tools**
* Per-model message count and cost
* Per-tool call count and average duration
**Charts**
Below the three-column section, three stacked charts provide a per-step view of the session:
A bar chart of cost per assistant message, ordered by sequence number. Useful for spotting expensive individual turns.
A bar chart of total tokens per assistant message. Rising bars indicate the context window is filling up.
A line chart of context window usage over time, with reference lines at 70 % (amber) and 100 % (red). Error steps are marked with red dots.
### Messages tab
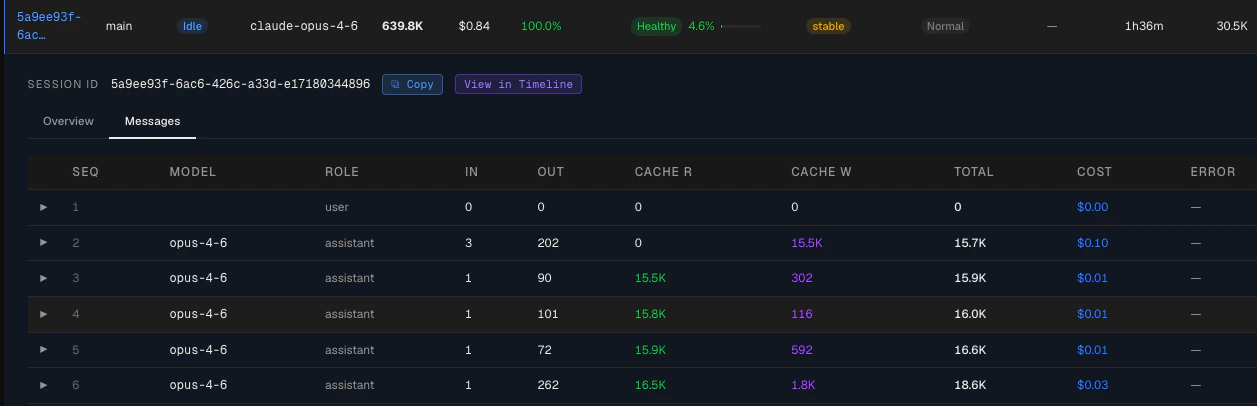 The Messages tab lists every message in the session in a table with:
* Sequence number, model, role
* Input, output, cache read, cache write, and total tokens
* Cost per message
* Error flag and error message
* Latency (time since previous message)
Click any row to expand the raw message content, including tool call inputs, tool results, and text blocks.
***
## Navigating to the Session Timeline
From the detail panel header, click **View in Timeline** to open the [Session Timeline](/debugging/session-timeline) for a full message-by-message visual breakdown of that session.
The Messages tab lists every message in the session in a table with:
* Sequence number, model, role
* Input, output, cache read, cache write, and total tokens
* Cost per message
* Error flag and error message
* Latency (time since previous message)
Click any row to expand the raw message content, including tool call inputs, tool results, and text blocks.
***
## Navigating to the Session Timeline
From the detail panel header, click **View in Timeline** to open the [Session Timeline](/debugging/session-timeline) for a full message-by-message visual breakdown of that session.
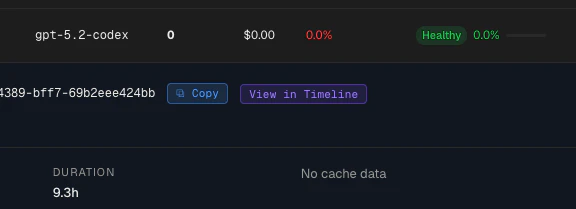 You can also navigate to a specific session directly via URL:
```text theme={null}
/sessions?q={session_id}
```
The page will auto-scroll to the matching row and open the detail panel.
You can also navigate to a specific session directly via URL:
```text theme={null}
/sessions?q={session_id}
```
The page will auto-scroll to the matching row and open the detail panel.