> ## Documentation Index
> Fetch the complete documentation index at: https://claw-lens.com/llms.txt
> Use this file to discover all available pages before exploring further.
# Overview
> The Overview dashboard gives you an at-a-glance view of your entire OpenClaw deployment — costs, sessions, agent health, active models, and recent activity — all on one page.
The Overview page is the home screen of Claw Lens. It pulls live data from your OpenClaw agents and presents the most important signals without requiring you to navigate between pages. From here you can spot cost spikes, failing agents, and stuck sessions at a glance.
## KPI strip
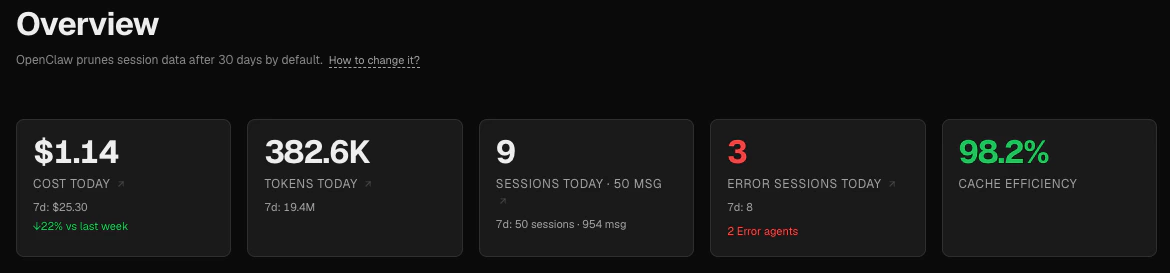
The top row shows five key metrics for today.
 | Metric | What it measures |
| ------------------------------ | --------------------------------------------------------------------------------------------------------- |
| **Cost today** | Total LLM spend since midnight, with a 7-day total and a week-over-week change indicator |
| **Tokens today** | Total tokens consumed since midnight, with a 7-day total |
| **Sessions today** | Number of sessions started since midnight, with a 7-day count and message total |
| **Sessions with errors today** | Sessions that contain at least one error message; shown in red when non-zero |
| **Cache efficiency** | Proportion of input-side tokens served from the prompt cache (`cache_read / (cache_read + input_tokens)`) |
Clicking any KPI card navigates you to the relevant detail page (Token Usage or Sessions).
***
## Agents panel
The Agents panel lists every active OpenClaw agent. Agents are sorted with errors first, then warnings, then healthy — so the agents that need attention appear at the top.
| Metric | What it measures |
| ------------------------------ | --------------------------------------------------------------------------------------------------------- |
| **Cost today** | Total LLM spend since midnight, with a 7-day total and a week-over-week change indicator |
| **Tokens today** | Total tokens consumed since midnight, with a 7-day total |
| **Sessions today** | Number of sessions started since midnight, with a 7-day count and message total |
| **Sessions with errors today** | Sessions that contain at least one error message; shown in red when non-zero |
| **Cache efficiency** | Proportion of input-side tokens served from the prompt cache (`cache_read / (cache_read + input_tokens)`) |
Clicking any KPI card navigates you to the relevant detail page (Token Usage or Sessions).
***
## Agents panel
The Agents panel lists every active OpenClaw agent. Agents are sorted with errors first, then warnings, then healthy — so the agents that need attention appear at the top.
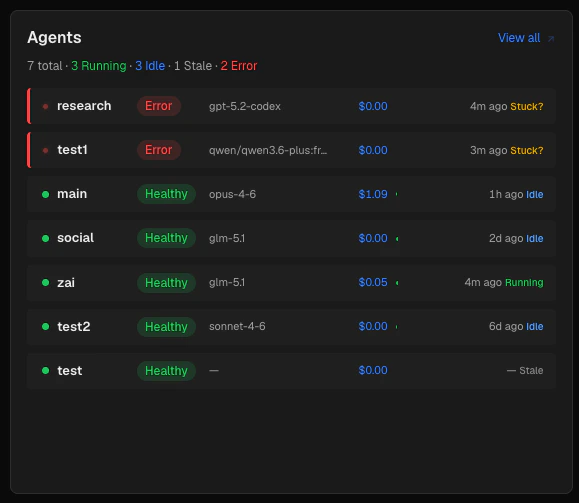 Each row shows:
* A **status dot** colored by health verdict (green / amber / red)
* The **agent name** and its **health badge** (`healthy`, `warning`, or `error`)
* The **primary model** (shortened for readability, e.g. `sonnet-4-5` instead of `claude-sonnet-4-5-latest`)
* **Today's cost** for that agent
* A **context bar** showing how full the context window was in the last session (green → amber → red as it approaches the limit)
* The **last activity time** and current **operational status**
### Health Status
| Status | Meaning |
| --------- | ------------------------------------------------------------------------------------------------- |
| `healthy` | No recent errors in the last 10 messages of the most recent session, and context usage below 80% |
| `warning` | 1–2 tool failures, or the agent hit `max_tokens` in the last 10 messages; or context usage 80–99% |
| `error` | 3+ tool failures, a session that ended with `stop_reason: error`, or context usage ≥ 100 % |
Health is calculated from the **last 10 messages** of the most recent non-cron session. Errors older than 6 hours are automatically cleared — they are no longer actionable.
### Operational states
| State | Color | Meaning |
| --------- | ----- | ----------------------------------------------------------------------------------------------------- |
| `running` | Green | The agent's session file was modified within the last 30 minutes |
| `stuck` | Amber | The session file was recently modified but the agent has recent tool failures or an error stop reason |
| `idle` | Blue | No session file activity in the last 30 minutes |
| `stale` | Gray | The agent directory exists but there are no recorded sessions |
***
## Models panel
The Models panel shows which LLM models are currently in use across all agents.
Each row shows:
* A **status dot** colored by health verdict (green / amber / red)
* The **agent name** and its **health badge** (`healthy`, `warning`, or `error`)
* The **primary model** (shortened for readability, e.g. `sonnet-4-5` instead of `claude-sonnet-4-5-latest`)
* **Today's cost** for that agent
* A **context bar** showing how full the context window was in the last session (green → amber → red as it approaches the limit)
* The **last activity time** and current **operational status**
### Health Status
| Status | Meaning |
| --------- | ------------------------------------------------------------------------------------------------- |
| `healthy` | No recent errors in the last 10 messages of the most recent session, and context usage below 80% |
| `warning` | 1–2 tool failures, or the agent hit `max_tokens` in the last 10 messages; or context usage 80–99% |
| `error` | 3+ tool failures, a session that ended with `stop_reason: error`, or context usage ≥ 100 % |
Health is calculated from the **last 10 messages** of the most recent non-cron session. Errors older than 6 hours are automatically cleared — they are no longer actionable.
### Operational states
| State | Color | Meaning |
| --------- | ----- | ----------------------------------------------------------------------------------------------------- |
| `running` | Green | The agent's session file was modified within the last 30 minutes |
| `stuck` | Amber | The session file was recently modified but the agent has recent tool failures or an error stop reason |
| `idle` | Blue | No session file activity in the last 30 minutes |
| `stale` | Gray | The agent directory exists but there are no recorded sessions |
***
## Models panel
The Models panel shows which LLM models are currently in use across all agents.
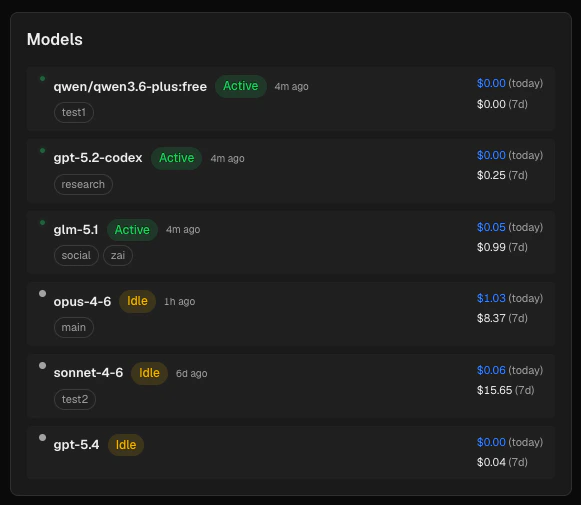 Each model card displays:
* An **active/idle badge**: a model is considered active if any agent using it had activity within the last hour
* The **agent names** that use this model as their primary model
* **Today's cost** and **7-day cost** for that model
Models are sorted by most recently active. Models that are idle and have no spending in the last 7 days are hidden.
***
## Recent sessions
The Recent Sessions panel lists the five most recently active **non-cron** sessions, sorted by last message time.
Each model card displays:
* An **active/idle badge**: a model is considered active if any agent using it had activity within the last hour
* The **agent names** that use this model as their primary model
* **Today's cost** and **7-day cost** for that model
Models are sorted by most recently active. Models that are idle and have no spending in the last 7 days are hidden.
***
## Recent sessions
The Recent Sessions panel lists the five most recently active **non-cron** sessions, sorted by last message time.
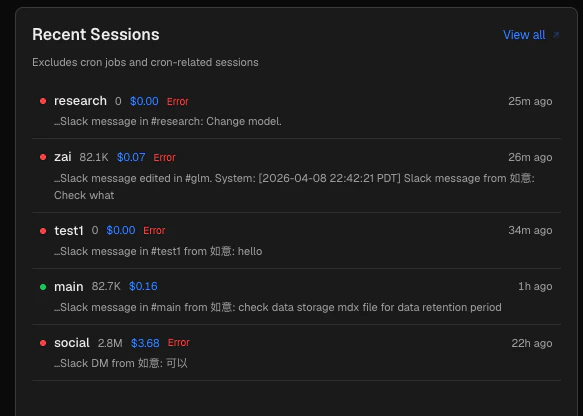 Each row shows:
* A status dot (green = no errors, red = has errors)
* Agent name, token count, and cost
* An optional **task summary** snippet — a short description of what the session was working on, extracted from the session file and cleaned of system prefixes
Clicking a session navigates to the Sessions page with that session pre-selected.
***
## Cron jobs
The Cron Jobs panel gives you a quick overview of your scheduled agents.
Each row shows:
* A status dot (green = no errors, red = has errors)
* Agent name, token count, and cost
* An optional **task summary** snippet — a short description of what the session was working on, extracted from the session file and cleaned of system prefixes
Clicking a session navigates to the Sessions page with that session pre-selected.
***
## Cron jobs
The Cron Jobs panel gives you a quick overview of your scheduled agents.
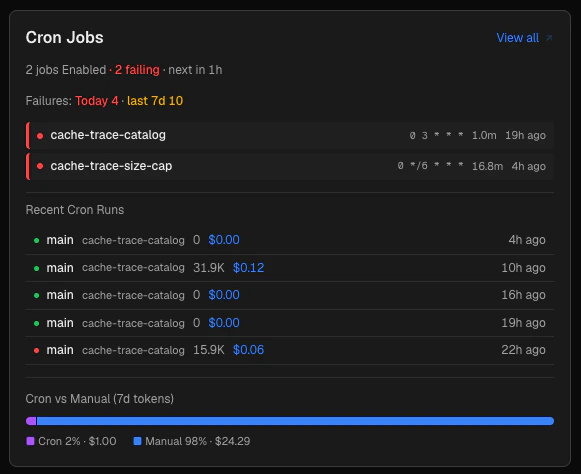 The header line shows:
* How many cron jobs are enabled
* How many are currently failing (consecutive errors > 0)
* When the next scheduled run is
Below that, a failure count table shows cron failures **today** and in the **last 7 days**.
Each enabled job is listed with:
* A status dot (green = last run OK, red = consecutive failures)
* The job name and its cron expression (e.g. `0 9 * * 1-5`)
* Duration of the last run
* When it last ran
Beneath the job list, the five most recent cron sessions appear, each linking to the Sessions page.
A **Cron vs Manual** stacked bar at the bottom shows the token split between scheduled and interactive workloads over the last 7 days.
***
## Live Monitor mini-panel
The header line shows:
* How many cron jobs are enabled
* How many are currently failing (consecutive errors > 0)
* When the next scheduled run is
Below that, a failure count table shows cron failures **today** and in the **last 7 days**.
Each enabled job is listed with:
* A status dot (green = last run OK, red = consecutive failures)
* The job name and its cron expression (e.g. `0 9 * * 1-5`)
* Duration of the last run
* When it last ran
Beneath the job list, the five most recent cron sessions appear, each linking to the Sessions page.
A **Cron vs Manual** stacked bar at the bottom shows the token split between scheduled and interactive workloads over the last 7 days.
***
## Live Monitor mini-panel
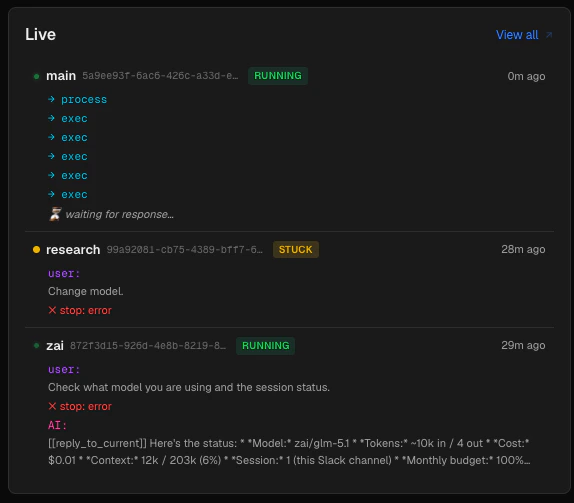 The Live Monitor panel on the bottom-left shows up to five sessions that are currently running or stuck. Each entry displays:
* A pulsing green dot (running) or amber dot (stuck)
* Agent name, session ID, and status badge
* How long ago the session last had activity
* The current step trace: the last user message, any tool calls in progress, and the most recent AI response
If no sessions are active, the panel shows "All quiet."
This panel polls every 5 seconds. For the full real-time view, click **View all** to open the [Live Monitor](/monitoring/live-monitor).
***
## Activity timeline
The Live Monitor panel on the bottom-left shows up to five sessions that are currently running or stuck. Each entry displays:
* A pulsing green dot (running) or amber dot (stuck)
* Agent name, session ID, and status badge
* How long ago the session last had activity
* The current step trace: the last user message, any tool calls in progress, and the most recent AI response
If no sessions are active, the panel shows "All quiet."
This panel polls every 5 seconds. For the full real-time view, click **View all** to open the [Live Monitor](/monitoring/live-monitor).
***
## Activity timeline
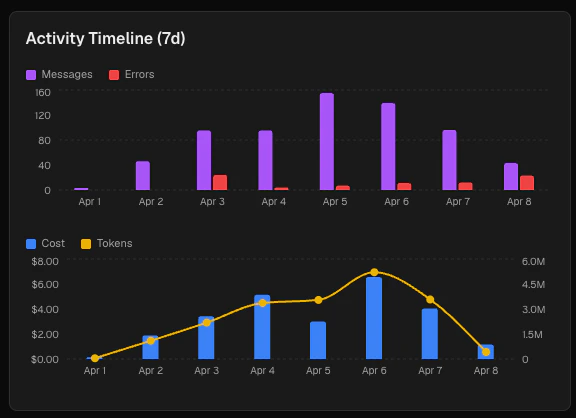 The Activity Timeline on the bottom-right contains two stacked charts covering the **last 7 days**.
**Chart 1 — Messages and errors**
A grouped bar chart comparing message volume (violet) against error count (red) for each day. Use this to spot days where error rates spiked relative to overall activity.
**Chart 2 — Cost and tokens**
A combined chart showing daily cost as bars (blue, left axis) and total tokens as a line (amber, right axis). The dual-axis layout lets you see whether cost and token growth are moving together or diverging.
Timeline data is bucketed by calendar day in your local timezone. A day with no activity does not appear as a bar; hover over any bar to see exact values.
***
## Data retention note
The Activity Timeline on the bottom-right contains two stacked charts covering the **last 7 days**.
**Chart 1 — Messages and errors**
A grouped bar chart comparing message volume (violet) against error count (red) for each day. Use this to spot days where error rates spiked relative to overall activity.
**Chart 2 — Cost and tokens**
A combined chart showing daily cost as bars (blue, left axis) and total tokens as a line (amber, right axis). The dual-axis layout lets you see whether cost and token growth are moving together or diverging.
Timeline data is bucketed by calendar day in your local timezone. A day with no activity does not appear as a bar; hover over any bar to see exact values.
***
## Data retention note
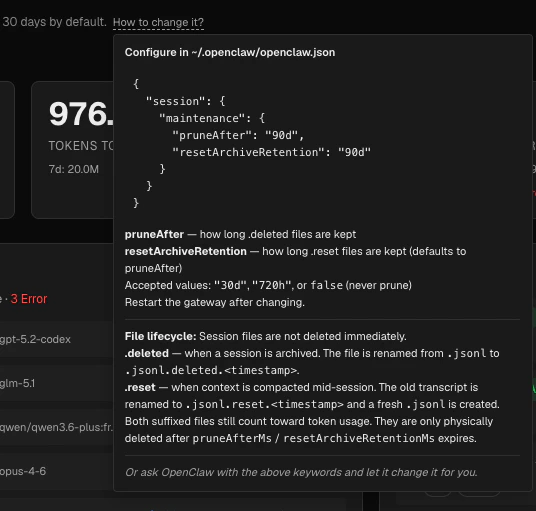 The Overview page displays a data retention notice in the header. Data is only available as long as the underlying OpenClaw session files exist on disk *— by default, OpenClaw removes sessions older than 30 days.* See [Data Storage](/reference/data-storage) for details on where Claw Lens stores its data, how it manages session lifecycle and how to change the retention period.