> ## Documentation Index
> Fetch the complete documentation index at: https://claw-lens.com/llms.txt
> Use this file to discover all available pages before exploring further.
# Agents
> The Agents page shows one card per OpenClaw agent with health status, current task, error rates, cache hit rates, cost data, and a 7-day activity breakdown.
The Agents page gives you a per-agent view of your entire OpenClaw deployment. Each agent gets its own card showing its current health, what it's working on right now, and aggregated statistics. Clicking a card expands detailed charts for that agent.
***
## KPI strip
The five KPIs at the top summarize the current agent fleet:
| Metric | Description |
| ---------------- | --------------------------------------------------------------------------- |
| **Total agents** | Total number of agents known to Claw Lens (from the DB and the filesystem) |
| **Running** | Agents currently running or stuck (session file modified within 30 minutes) |
| **Idle** | Agents with no session file activity in the last 30 minutes |
| **Still** | Agents that exist as directories but have no recorded sessions |
| **Error agents** | Agents whose health status is currently `error` |
***
## Agent cards
Agents are sorted by most recently active, with agents whose directories no longer exist moved to the end. Cards are displayed in a responsive grid.
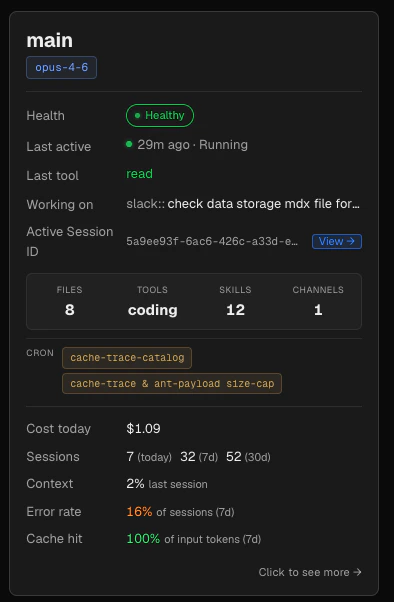 ### Card header
The card header shows:
* **Agent name** in large bold text
* **Primary model** pill showing the shortened model name (e.g. `sonnet-4-5` rather than `claude-sonnet-4-5-latest`). If the agent has never run a session, the pill shows "No sessions yet."
* A **Removed** badge if the agent directory no longer exists on disk
### Detail rows
Each card has a set of labeled rows:
The health verdict badge: `healthy` (green), `warning` (amber), or `error` (red). Below the badge, any active health reasons are listed — for example, "3 tool failures in last 10 messages" or "context at 87 % — approaching limit".
Health is calculated from the last 10 messages of the most recent non-cron session. Errors older than 6 hours are automatically cleared.
How long ago the agent had activity, and its current operational status: `running`, `stuck`, `idle`, or `stale`. The status dot pulses green when the agent is actively running.
The most recently called tool name, shown only when the agent is running or stuck. Colored green for running agents, amber for stuck ones.
The most recent user message from the agent's latest session file, stripped of cron prefixes and Slack routing headers. For messages sent via Slack, a `slack::` prefix appears before the task text. Shows `—` when there is no current task.
When the agent has a current task, the session ID is shown in small monospace text with a **View →** button that navigates to that session in the Sessions browser.
### Config grid
A four-column mini-stat grid at the bottom of the card shows:
| Stat | Description |
| ------------ | ------------------------------------------------------------------- |
| **Files** | Number of `.md` and `.txt` files in the agent's workspace directory |
| **Tools** | The tools profile name from `openclaw.json` |
| **Skills** | Number of skills loaded in the most recent session |
| **Channels** | Number of Slack channels this agent is bound to |
Below the grid, the agent's cron task names are shown as pills (if any are configured).
### Footer stats
For agents that have at least one recorded session, the card footer shows:
Today's cost for this agent, calculated from messages with timestamps since midnight. Shows `—` if there has been no activity today.
Session counts for today, the last 7 days, and the last 30 days, displayed inline as `X (today) · X (7d) · X (30d)`.
Context window utilization from the last assistant message in the most recent session. Color-coded: normal below 60 %, amber at 60–79 %, bright amber at 80–99 %, red at 100 %.
Percentage of sessions in the last 7 days that contained at least one error. Green at 0 %, orange at 1–24 %, red at 25 %+.
`cache_read / (cache_read + input_tokens)` across all messages in the last 7 days. Green at 60 %+, yellow at 30–59 %, muted below 30 %.
***
## Health status logic
Health is computed server-side on every data fetch. It reflects only the current state of the agent's most recent non-cron session — not historical errors.
The health engine inspects the last 10 messages of the most recent non-cron session:
| Verdict | Conditions |
| --------- | ----------------------------------------------------------------------------------------------------------------- |
| `healthy` | No errors, no `max_tokens`, no `stop_reason: error` in the last 10 messages |
| `warning` | 1–2 tool failures, or the session hit `max_tokens` |
| `error` | 3+ tool failures, or the last message had `stop_reason: error`, or the last session's context window was at 100 % |
Context pressure from the last session can also elevate health:
* Context ≥ 80 %: upgrades from `healthy` to `warning` with reason "context at X% — approaching limit"
* Context ≥ 100 %: upgrades to `error` with reason "context at X% — likely hit limit"
If the most recent message is older than 6 hours, the agent always returns `healthy` regardless of past errors.
***
## Agent detail panel
Click the **Click to see more** button at the bottom of any card to expand a full-width detail panel below it. Click the button again (now labeled **Close ↑**) or the `✕` in the panel header to collapse it.
### Card header
The card header shows:
* **Agent name** in large bold text
* **Primary model** pill showing the shortened model name (e.g. `sonnet-4-5` rather than `claude-sonnet-4-5-latest`). If the agent has never run a session, the pill shows "No sessions yet."
* A **Removed** badge if the agent directory no longer exists on disk
### Detail rows
Each card has a set of labeled rows:
The health verdict badge: `healthy` (green), `warning` (amber), or `error` (red). Below the badge, any active health reasons are listed — for example, "3 tool failures in last 10 messages" or "context at 87 % — approaching limit".
Health is calculated from the last 10 messages of the most recent non-cron session. Errors older than 6 hours are automatically cleared.
How long ago the agent had activity, and its current operational status: `running`, `stuck`, `idle`, or `stale`. The status dot pulses green when the agent is actively running.
The most recently called tool name, shown only when the agent is running or stuck. Colored green for running agents, amber for stuck ones.
The most recent user message from the agent's latest session file, stripped of cron prefixes and Slack routing headers. For messages sent via Slack, a `slack::` prefix appears before the task text. Shows `—` when there is no current task.
When the agent has a current task, the session ID is shown in small monospace text with a **View →** button that navigates to that session in the Sessions browser.
### Config grid
A four-column mini-stat grid at the bottom of the card shows:
| Stat | Description |
| ------------ | ------------------------------------------------------------------- |
| **Files** | Number of `.md` and `.txt` files in the agent's workspace directory |
| **Tools** | The tools profile name from `openclaw.json` |
| **Skills** | Number of skills loaded in the most recent session |
| **Channels** | Number of Slack channels this agent is bound to |
Below the grid, the agent's cron task names are shown as pills (if any are configured).
### Footer stats
For agents that have at least one recorded session, the card footer shows:
Today's cost for this agent, calculated from messages with timestamps since midnight. Shows `—` if there has been no activity today.
Session counts for today, the last 7 days, and the last 30 days, displayed inline as `X (today) · X (7d) · X (30d)`.
Context window utilization from the last assistant message in the most recent session. Color-coded: normal below 60 %, amber at 60–79 %, bright amber at 80–99 %, red at 100 %.
Percentage of sessions in the last 7 days that contained at least one error. Green at 0 %, orange at 1–24 %, red at 25 %+.
`cache_read / (cache_read + input_tokens)` across all messages in the last 7 days. Green at 60 %+, yellow at 30–59 %, muted below 30 %.
***
## Health status logic
Health is computed server-side on every data fetch. It reflects only the current state of the agent's most recent non-cron session — not historical errors.
The health engine inspects the last 10 messages of the most recent non-cron session:
| Verdict | Conditions |
| --------- | ----------------------------------------------------------------------------------------------------------------- |
| `healthy` | No errors, no `max_tokens`, no `stop_reason: error` in the last 10 messages |
| `warning` | 1–2 tool failures, or the session hit `max_tokens` |
| `error` | 3+ tool failures, or the last message had `stop_reason: error`, or the last session's context window was at 100 % |
Context pressure from the last session can also elevate health:
* Context ≥ 80 %: upgrades from `healthy` to `warning` with reason "context at X% — approaching limit"
* Context ≥ 100 %: upgrades to `error` with reason "context at X% — likely hit limit"
If the most recent message is older than 6 hours, the agent always returns `healthy` regardless of past errors.
***
## Agent detail panel
Click the **Click to see more** button at the bottom of any card to expand a full-width detail panel below it. Click the button again (now labeled **Close ↑**) or the `✕` in the panel header to collapse it.
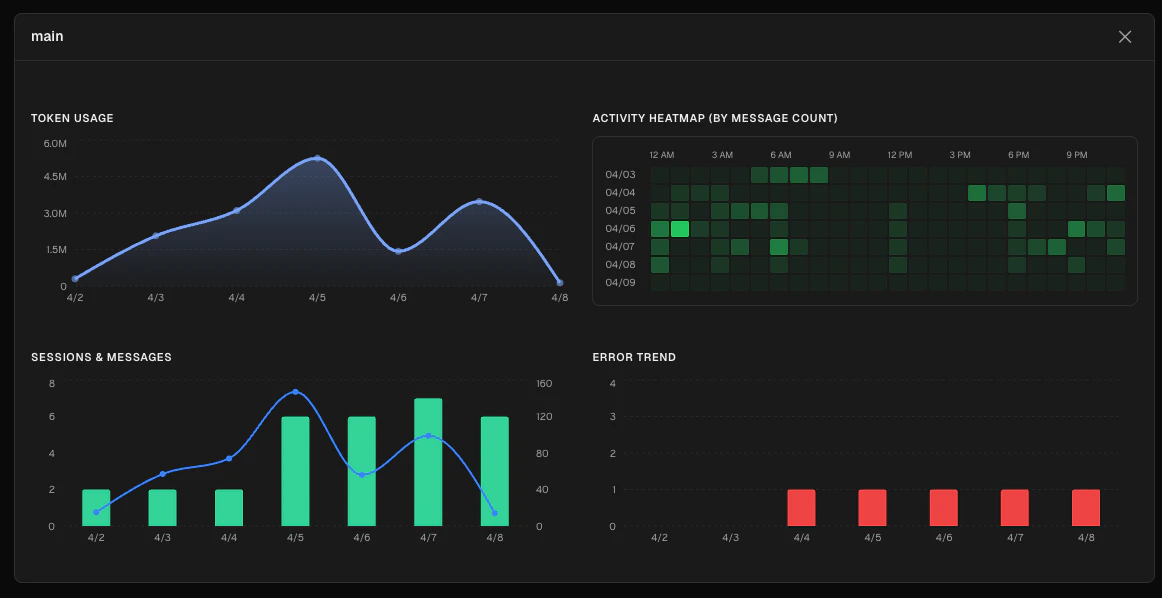 The detail panel shows four charts for the last 7 days:
An area chart of total tokens per day. Hover to see exact token and cost values.
A 7-day × 24-hour heatmap of tool call counts. Each cell is colored by activity intensity — deeper green means more tool calls in that hour. Useful for understanding when the agent is most active and spotting unusual activity patterns.
A combined chart with bars for daily session count (green, left axis) and a line for message count (blue, right axis).
A bar chart of sessions with errors per day. Use this alongside the Sessions chart to track whether error rates are improving or worsening.
The detail panel shows four charts for the last 7 days:
An area chart of total tokens per day. Hover to see exact token and cost values.
A 7-day × 24-hour heatmap of tool call counts. Each cell is colored by activity intensity — deeper green means more tool calls in that hour. Useful for understanding when the agent is most active and spotting unusual activity patterns.
A combined chart with bars for daily session count (green, left axis) and a line for message count (blue, right axis).
A bar chart of sessions with errors per day. Use this alongside the Sessions chart to track whether error rates are improving or worsening.