> ## Documentation Index
> Fetch the complete documentation index at: https://claw-lens.com/llms.txt
> Use this file to discover all available pages before exploring further.
# Session timeline
> Inspect every LLM turn and tool call in a Gantt-style chart. Drill into token counts, latency, and raw tool I/O for any session.
The Session Timeline gives you a turn-by-turn view of a single OpenClaw agent session. Each row in the chart represents one LLM call (a *turn*), and colored bars inside it show the LLM latency and each tool call side-by-side. You can expand any turn to read the full user prompt, the assistant's response, and the raw input/output of every tool that ran.
## KPI strip
At the top of the page, a strip of six metrics summarizes the selected session:
| Metric | What it measures |
| ----------------- | ----------------------------------------------------------------------- |
| **Wall duration** | Real elapsed time from session start to finish, including all idle gaps |
| **Active time** | Compressed duration — only the time the agent was actually working |
| **LLM API calls** | Total number of turns (one per LLM request) |
| **Tool calls** | Total number of tool calls across all turns |
| **LLM time** | Sum of all LLM inference latency across every turn |
| **Tool time** | Sum of parallel-aware wall-clock tool execution time across every turn |
## Selecting a session
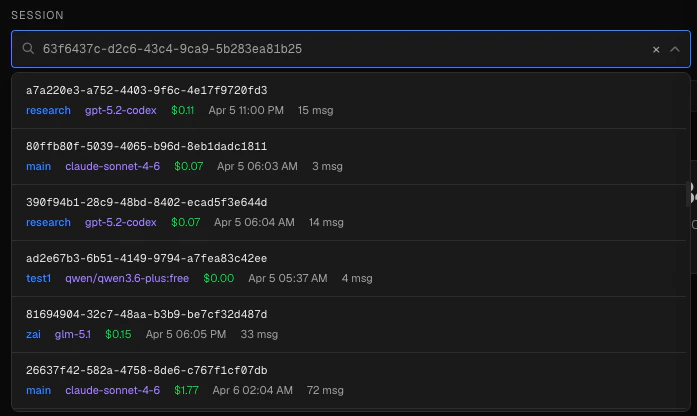 Use the session picker below the page title to choose which session to inspect.
* Type any part of a session ID or agent name to filter the list.
* The dropdown shows the full session ID, agent name, primary model, total cost, and end time for each session.
* You can paste a complete UUID directly into the input — the picker will auto-select the matching session.
* Click **×** to clear the current selection and return to the empty state.
The session ID is also reflected in the page URL (`?session=`), so you can bookmark or share a direct link to any session.
## The Gantt chart
The chart uses *compressed* time on its horizontal axis. The axis is divided into 8 evenly spaced tick marks that span the session's active duration.
### Compressed vs wall-clock time
Use the session picker below the page title to choose which session to inspect.
* Type any part of a session ID or agent name to filter the list.
* The dropdown shows the full session ID, agent name, primary model, total cost, and end time for each session.
* You can paste a complete UUID directly into the input — the picker will auto-select the matching session.
* Click **×** to clear the current selection and return to the empty state.
The session ID is also reflected in the page URL (`?session=`), so you can bookmark or share a direct link to any session.
## The Gantt chart
The chart uses *compressed* time on its horizontal axis. The axis is divided into 8 evenly spaced tick marks that span the session's active duration.
### Compressed vs wall-clock time
 Idle gaps — periods where the agent was waiting for user input or doing nothing — are collapsed out of the chart. The notice bar above the chart tells you how many gaps were compressed. The **Wall duration** KPI shows the true elapsed time, while **Active time** shows the compressed duration used for chart positioning.
Wall-clock timestamps are preserved in the expanded turn detail view (shown as "+ elapsed" from session start). The compression only affects chart positioning.
### Turns (rows)
Idle gaps — periods where the agent was waiting for user input or doing nothing — are collapsed out of the chart. The notice bar above the chart tells you how many gaps were compressed. The **Wall duration** KPI shows the true elapsed time, while **Active time** shows the compressed duration used for chart positioning.
Wall-clock timestamps are preserved in the expanded turn detail view (shown as "+ elapsed" from session start). The compression only affects chart positioning.
### Turns (rows)
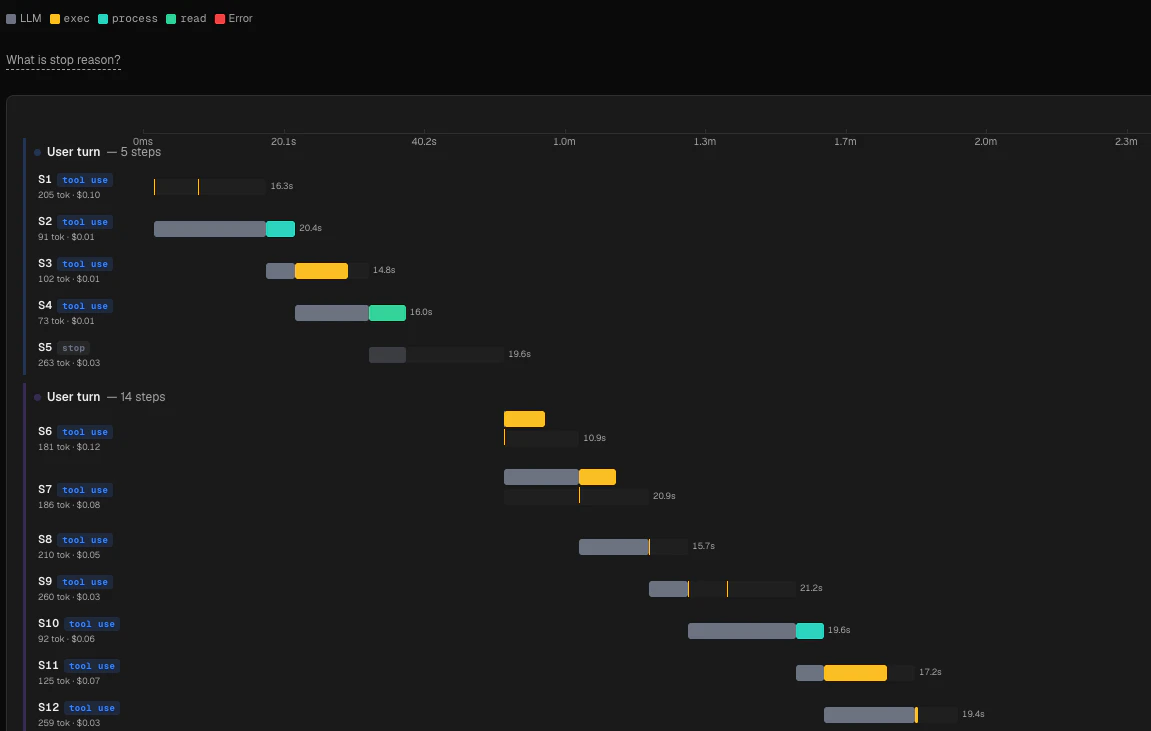 Each row represents one assistant turn, labeled `S1`, `S2`, and so on. The row label also shows:
* Total tokens for that turn and its cost
* A **stop reason pill** — see below for what each value means
A gray background bar spans the full turn duration. Inside it:
* A **dark gray segment** at the left edge represents LLM inference time.
* **Colored segments** represent individual tool calls, positioned at their actual compressed start time.
Click any row to expand it and see the full turn detail.
### Stop reasons
Each turn ends with one of five stop reasons, shown as a colored pill next to the sequence number:
| Pill | Meaning |
| --------- | ------------------------------------------------------------------------------ |
| `stop` | Model finished naturally (equivalent to Anthropic `end_turn` or OpenAI `stop`) |
| `toolUse` | Model requested a tool call — the turn continues |
| `length` | Response was cut off by the `max_tokens` limit |
| `error` | An API, network, or provider error occurred |
| `aborted` | The run was cancelled via an abort signal |
A `length` stop reason means the model ran out of output tokens and its response may be incomplete. Check the turn's token counts if you see this.
### Parallel tool calls
When your agent issues multiple tool calls in a single turn, Claw Lens detects this and stacks them in separate horizontal *lanes* within the same turn row. Each lane represents one parallel execution track. The row height grows automatically to fit all lanes.
Each row represents one assistant turn, labeled `S1`, `S2`, and so on. The row label also shows:
* Total tokens for that turn and its cost
* A **stop reason pill** — see below for what each value means
A gray background bar spans the full turn duration. Inside it:
* A **dark gray segment** at the left edge represents LLM inference time.
* **Colored segments** represent individual tool calls, positioned at their actual compressed start time.
Click any row to expand it and see the full turn detail.
### Stop reasons
Each turn ends with one of five stop reasons, shown as a colored pill next to the sequence number:
| Pill | Meaning |
| --------- | ------------------------------------------------------------------------------ |
| `stop` | Model finished naturally (equivalent to Anthropic `end_turn` or OpenAI `stop`) |
| `toolUse` | Model requested a tool call — the turn continues |
| `length` | Response was cut off by the `max_tokens` limit |
| `error` | An API, network, or provider error occurred |
| `aborted` | The run was cancelled via an abort signal |
A `length` stop reason means the model ran out of output tokens and its response may be incomplete. Check the turn's token counts if you see this.
### Parallel tool calls
When your agent issues multiple tool calls in a single turn, Claw Lens detects this and stacks them in separate horizontal *lanes* within the same turn row. Each lane represents one parallel execution track. The row height grows automatically to fit all lanes.
 ### Color legend
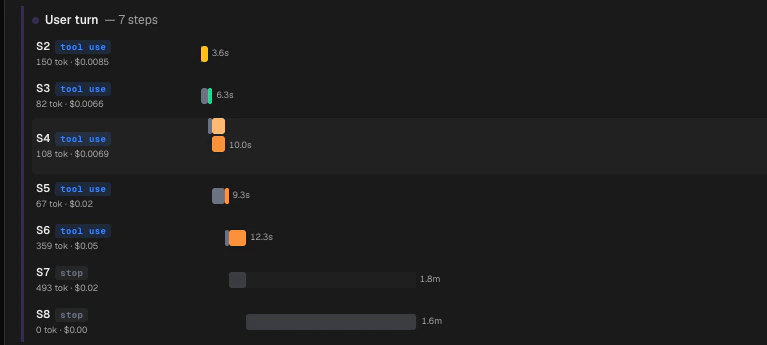
The legend above the chart shows a swatch for each tool that appeared in the session. The following built-in tools have fixed colors:
* `exec` / `Bash` — amber
* `read` / `Read` — green
* `write` / `Write` — purple
* `edit` / `Edit` — cyan
* `web_fetch` / `WebFetch` — orange
* `web_search` / `WebSearch` — peach
* `sessions_spawn` / `Agent` — pink
Failed tool calls are always shown in **red** regardless of the tool type.
## Turn detail
### Color legend
The legend above the chart shows a swatch for each tool that appeared in the session. The following built-in tools have fixed colors:
* `exec` / `Bash` — amber
* `read` / `Read` — green
* `write` / `Write` — purple
* `edit` / `Edit` — cyan
* `web_fetch` / `WebFetch` — orange
* `web_search` / `WebSearch` — peach
* `sessions_spawn` / `Agent` — pink
Failed tool calls are always shown in **red** regardless of the tool type.
## Turn detail
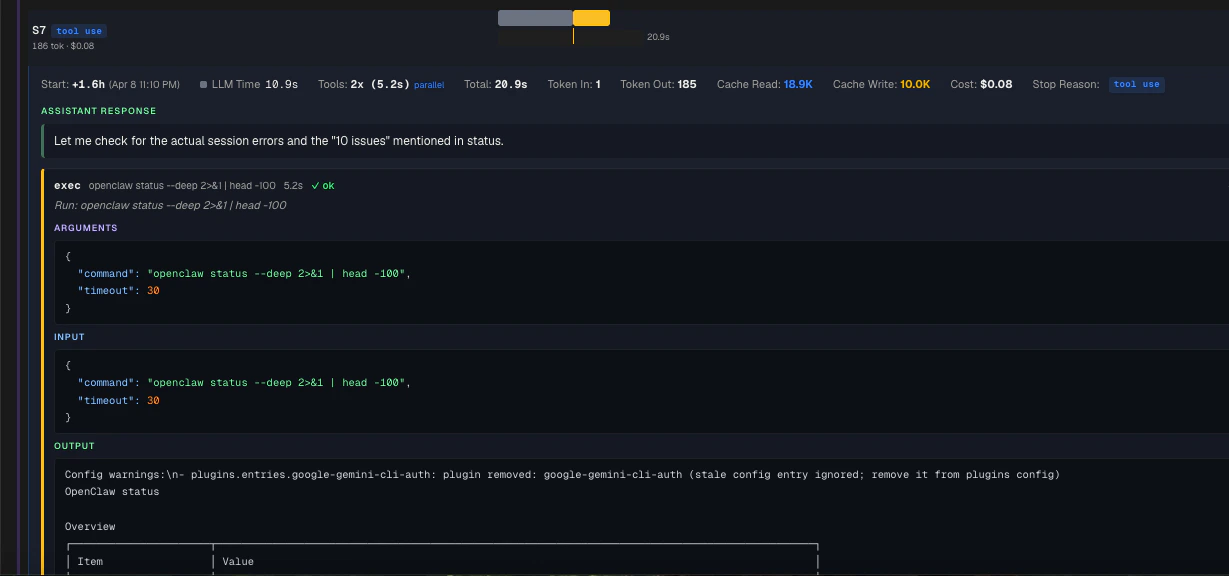 Click any turn row to expand its inline detail panel. The panel shows:
**Timing summary**
* Wall-clock start time (offset from session start, with an absolute timestamp)
* LLM inference time
* Number of tool calls and their parallel-aware wall-clock span
* Total turn duration
* Whether parallel execution was detected
**Token counts**
* Input tokens
* Output tokens
* Cache read tokens (shown in blue when present)
* Cache write tokens (shown in amber when present)
* Turn cost
**Stop reason** — repeated with a colored pill, plus the parsed error message if the stop reason was `error`.
**Message context** — the text of the user message that triggered this turn, and the assistant's text response. These are fetched live from the session log.
### Tool call cards
Each tool call in the turn renders as its own card with a colored left border. The card shows:
* **Tool name** and target path or URL (when available)
* **Duration** and **success/failure** status
* A natural-language summary for common tools (`exec`, `read`, `write`, `edit`, `web_search`, `web_fetch`)
* **Arguments** — the parsed JSON input the model passed to the tool
* **Raw input** and **raw output** — the exact bytes sent and received, pretty-printed if valid JSON
If a tool call is red in the chart, open its card in the expanded turn detail to read the raw output — the error message is usually there.
## Navigating from other pages
Several other Claw Lens pages link directly into the Session Timeline with a specific turn pre-selected:
* The **Tool Profiler** links slow calls to the turn in which they occurred.
* The **Deep Turn** page links deep turns directly to the timeline with the turn highlighted.
When you arrive via a direct link, the target turn is automatically expanded and highlighted with a blue outline for five seconds.
Click any turn row to expand its inline detail panel. The panel shows:
**Timing summary**
* Wall-clock start time (offset from session start, with an absolute timestamp)
* LLM inference time
* Number of tool calls and their parallel-aware wall-clock span
* Total turn duration
* Whether parallel execution was detected
**Token counts**
* Input tokens
* Output tokens
* Cache read tokens (shown in blue when present)
* Cache write tokens (shown in amber when present)
* Turn cost
**Stop reason** — repeated with a colored pill, plus the parsed error message if the stop reason was `error`.
**Message context** — the text of the user message that triggered this turn, and the assistant's text response. These are fetched live from the session log.
### Tool call cards
Each tool call in the turn renders as its own card with a colored left border. The card shows:
* **Tool name** and target path or URL (when available)
* **Duration** and **success/failure** status
* A natural-language summary for common tools (`exec`, `read`, `write`, `edit`, `web_search`, `web_fetch`)
* **Arguments** — the parsed JSON input the model passed to the tool
* **Raw input** and **raw output** — the exact bytes sent and received, pretty-printed if valid JSON
If a tool call is red in the chart, open its card in the expanded turn detail to read the raw output — the error message is usually there.
## Navigating from other pages
Several other Claw Lens pages link directly into the Session Timeline with a specific turn pre-selected:
* The **Tool Profiler** links slow calls to the turn in which they occurred.
* The **Deep Turn** page links deep turns directly to the timeline with the turn highlighted.
When you arrive via a direct link, the target turn is automatically expanded and highlighted with a blue outline for five seconds.