> ## Documentation Index
> Fetch the complete documentation index at: https://claw-lens.com/llms.txt
> Use this file to discover all available pages before exploring further.
# Tool profiler
> Aggregate tool call performance across all sessions or a single session. Find slow tools, high error rates, and duration distributions at a glance.
The Tool Profiler aggregates every tool call your OpenClaw agents have made and surfaces latency percentiles, call counts, and error rates in a single table. Use it to find tools that are slowing down your agents or failing more than expected.
## Session scope
By default the profiler shows aggregate stats across **all sessions**. To narrow the view to a specific run, use the session picker at the top of the page.
* Type any part of a session ID or agent name to filter.
* Select **All sessions** (the first option in the dropdown) to return to the aggregate view.
* The table and all drill-down data update immediately when you change the session filter.
Scoping to a single session is useful when you want to understand why one particular run was slow, without noise from other sessions.
## The profiler table
The table lists every tool that has been called at least once, sorted by total time (average duration × timed call count) in descending order. The tool that consumed the most cumulative time appears first.
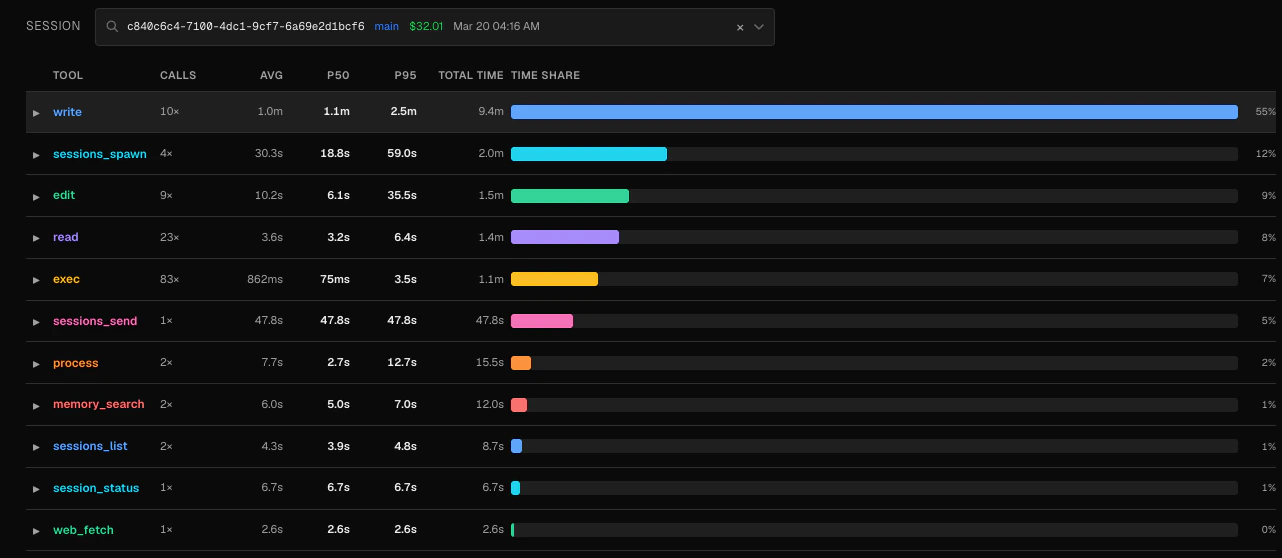 | Column | Description |
| -------------- | -------------------------------------------------------------------------- |
| **Tool** | Tool name as recorded in the session log |
| **Calls** | Total number of times this tool was called |
| **Avg** | Mean duration across all calls that have timing data |
| **P50** | Median duration — half of calls complete faster than this |
| **P95** | 95th-percentile duration — the slowest 5% of calls take at least this long |
| **Total time** | `avg_duration × timed_count` — a proxy for total wall-clock time consumed |
| **Time share** | Percentage of total tool time this tool accounts for, shown as a bar |
Not every call has timing data. The **Calls** column counts all invocations, while **Avg**, **P50**, and **P95** are computed only from calls that have a recorded `duration_ms`. A large gap between the two suggests some calls are missing timing instrumentation.
## Drill-down: duration distribution
Click any row to expand a histogram of that tool's call durations. Duration buckets are fixed:
| Column | Description |
| -------------- | -------------------------------------------------------------------------- |
| **Tool** | Tool name as recorded in the session log |
| **Calls** | Total number of times this tool was called |
| **Avg** | Mean duration across all calls that have timing data |
| **P50** | Median duration — half of calls complete faster than this |
| **P95** | 95th-percentile duration — the slowest 5% of calls take at least this long |
| **Total time** | `avg_duration × timed_count` — a proxy for total wall-clock time consumed |
| **Time share** | Percentage of total tool time this tool accounts for, shown as a bar |
Not every call has timing data. The **Calls** column counts all invocations, while **Avg**, **P50**, and **P95** are computed only from calls that have a recorded `duration_ms`. A large gap between the two suggests some calls are missing timing instrumentation.
## Drill-down: duration distribution
Click any row to expand a histogram of that tool's call durations. Duration buckets are fixed:
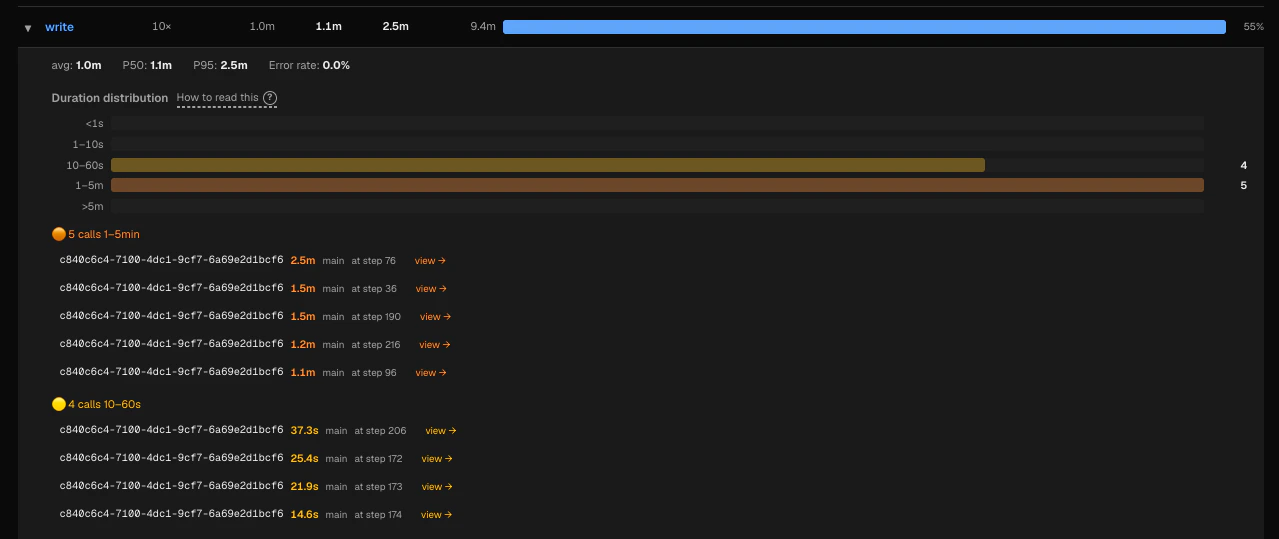 | Bucket | Interpretation |
| -------- | ---------------------------------------------------------- |
| `<1s` | Fast — expected for most read/search operations |
| `1–10s` | Normal for web fetches or moderate shell commands |
| `10–60s` | Worth investigating if unexpected |
| `1–5m` | Slow — likely a long-running process or stuck network call |
| `>5m` | Very slow — almost always a problem |
Below the histogram, slow calls are grouped into three tiers:
* **>5m** — the slowest outliers
* **1–5m** — significantly slow
* **10–60s** — moderately slow
Each slow call shows the session ID, duration, agent name, and turn number. Click any slow call to jump directly to that turn in the **Session Timeline**.
## Identifying problems
**Slow tools** — A high p95 relative to p50 means the tool has a long tail: most calls are fast but occasional calls take much longer. This often points to intermittent network timeouts, large file I/O, or resource contention.
**Frequently failing tools** — The expanded detail panel shows error rate as a percentage. An error rate above a few percent usually means something is consistently wrong: a broken path, a permission error, or an unstable external service.
**High time share** — A tool with a large time-share bar is consuming a disproportionate amount of your agent's wall-clock time. Even if individual calls are fast, a high call count can make a tool a bottleneck.
Suppose `web_fetch` shows a p50 of 800ms but a p95 of 12s. Expanding the row reveals several calls in the `10–60s` bucket. Clicking one takes you to the Session Timeline, where the turn detail shows the raw output — a connection timeout to a slow third-party API. You can then add a timeout parameter to your agent's fetch calls or cache the result.
| Bucket | Interpretation |
| -------- | ---------------------------------------------------------- |
| `<1s` | Fast — expected for most read/search operations |
| `1–10s` | Normal for web fetches or moderate shell commands |
| `10–60s` | Worth investigating if unexpected |
| `1–5m` | Slow — likely a long-running process or stuck network call |
| `>5m` | Very slow — almost always a problem |
Below the histogram, slow calls are grouped into three tiers:
* **>5m** — the slowest outliers
* **1–5m** — significantly slow
* **10–60s** — moderately slow
Each slow call shows the session ID, duration, agent name, and turn number. Click any slow call to jump directly to that turn in the **Session Timeline**.
## Identifying problems
**Slow tools** — A high p95 relative to p50 means the tool has a long tail: most calls are fast but occasional calls take much longer. This often points to intermittent network timeouts, large file I/O, or resource contention.
**Frequently failing tools** — The expanded detail panel shows error rate as a percentage. An error rate above a few percent usually means something is consistently wrong: a broken path, a permission error, or an unstable external service.
**High time share** — A tool with a large time-share bar is consuming a disproportionate amount of your agent's wall-clock time. Even if individual calls are fast, a high call count can make a tool a bottleneck.
Suppose `web_fetch` shows a p50 of 800ms but a p95 of 12s. Expanding the row reveals several calls in the `10–60s` bucket. Clicking one takes you to the Session Timeline, where the turn detail shows the raw output — a connection timeout to a slow third-party API. You can then add a timeout parameter to your agent's fetch calls or cache the result.